 Time in status | SLA | Timer | Stopwatch
Depending on the capabilities of your server, you can allocate additional resources that the plugin can use. Basic computations are handled well in parallel, and additional threads can greatly speed up processing. The difference will be more noticeable with large amounts of data.
During plugin downtime, the allocated resources remain available to the system. They are only used when performing tasks.
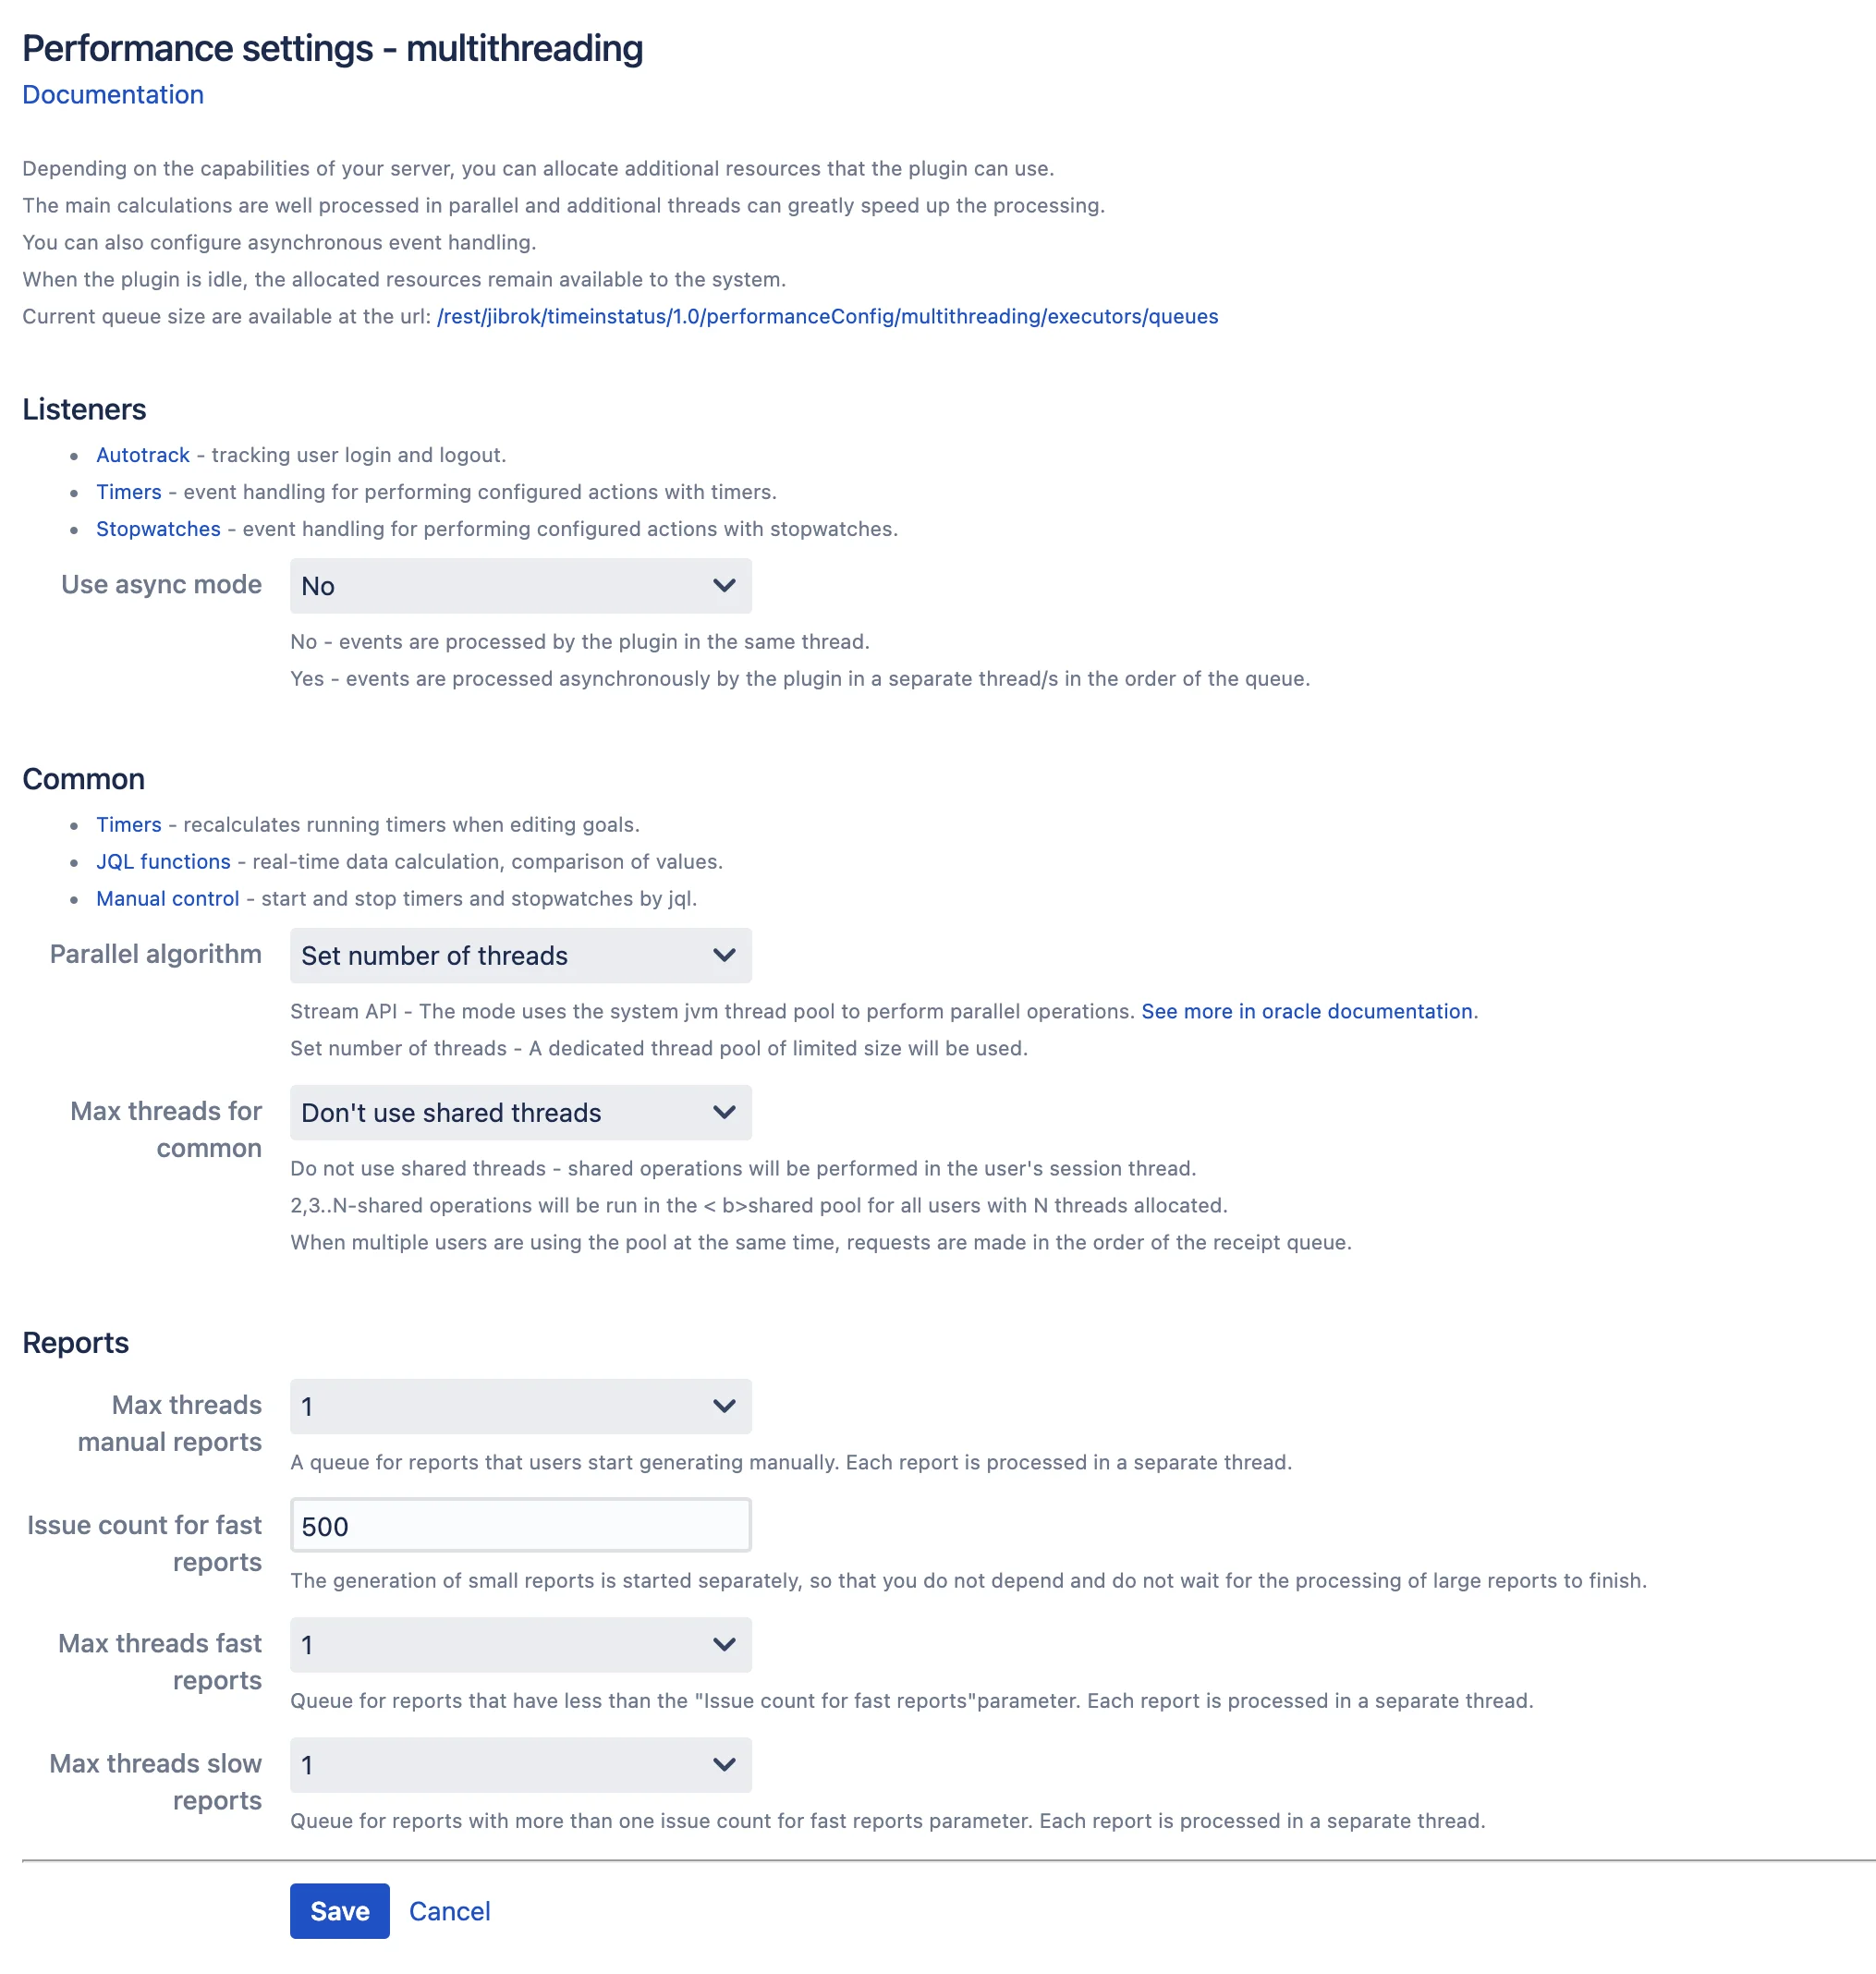
Queue size statistics available by url: {baseUrl}/rest/jibrok/timeinstatus/1.0/performanceConfig/multithreading/executors/queues
All settings:
Listeners
You can set up asynchronous event handling. This will remove any lags in the UI caused by event handling. In this case, the user interface will not wait for the processing of events to be executed in the background mode.
Relevant for:
- Loaded systems.
- For timers and stopwatches that respond to task editing and transitions between statuses. These operations are quite slow on their own.
- Autotrack.
Common
The following functionality uses multithreading:
- JQL functions - calculation of data in real time, comparison of values.
- Timer - event handling, recalculation of running timers when editing targets.
- Stopwatch - event handling.
- Manual control - start and stop timers and stopwatches by jql.
The main beneficiaries of multithreading are real-time data search functions. And as a consequence, dashboards and filters that use these functions.
There are two multithreading modes available:
-
Setting the number of used streams manually. The maximum number of threads available is limited by the number of cpu available jvm. By setting the maximum number, you allow the plugin to load all processor cores simultaneously. We do not recommend doing this. This can lead to freezes for all users of the system when the processor is used at 100%. This setting is selected individually (possibly dynamically) depending on your servers, environment and load generated by your users.
-
Using stream api: this setting simply transfers all jvm tasks to be executed and jvm itself determines how many resources it can allocate for solving these tasks. This setting shows the maximum performance gain. But it also has one problem (as well as using the maximum number of threads) - a shared pool is used to perform tasks. And tasks from the plugin can delay other jvm computations. This can lead to intermittent delays in a wide variety of locations. more info
If 1 thread is used, the calculations will be performed by the current thread of the user’s session.
If more than one thread is used, then they are taken from one common thread pool for all users.
Latency problems are common in large and heavy computations. For example, calculating the time in the status for 1,000,000 tasks is a rather difficult operation. Allowing the plugin to fully utilize the processor can cause the expected brakes in Jira while performing such calculations. To avoid unreasonably heavy calculations, there are limits on the number of calculated tasks within one request. This will reduce the latency almost linearly. If 1,000,000 tasks take N seconds and create a delay of N seconds. Then reducing the number of tasks by 100 times will reduce the delay time by 100 times.
see Performance settings - JQL: Count limit
Below is a table with experimental data. The table is based on real data, but serves solely to demonstrate the dynamics of changes in the query execution time depending on the settings.
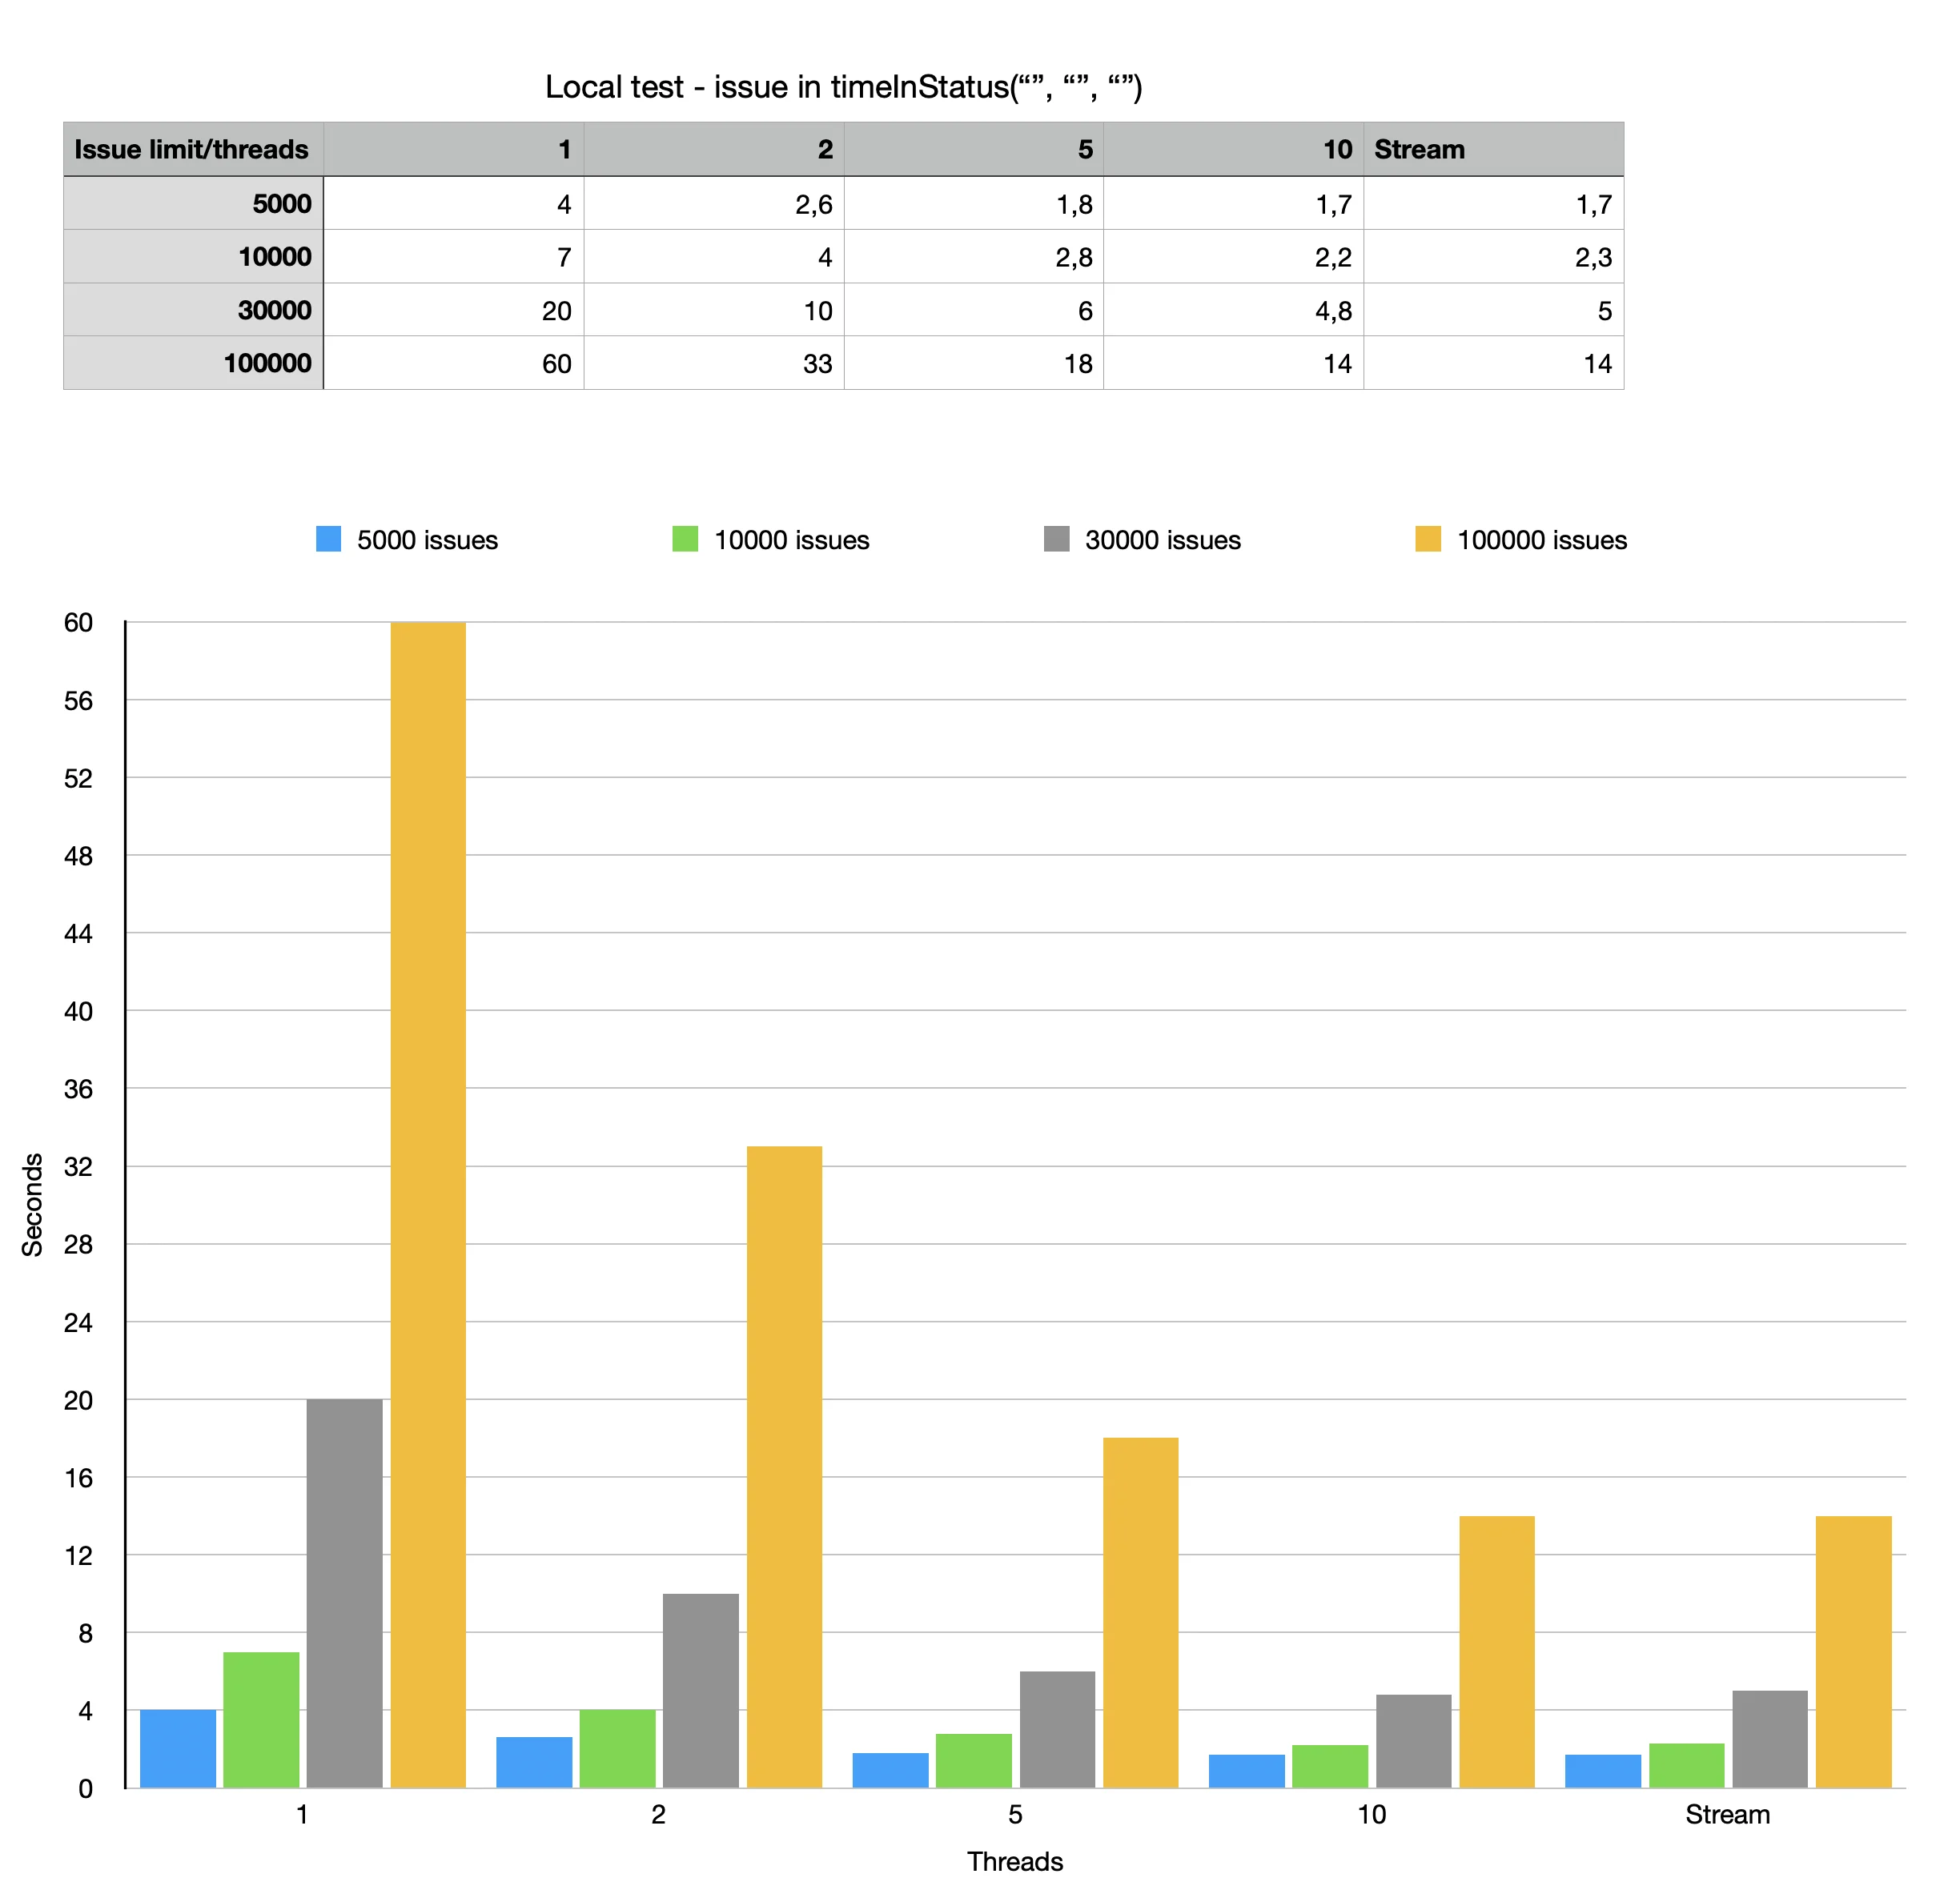
The engine has not yet exhausted all the optimization possibilities. It will get better in newer versions of the app.
In general, you need to focus on free processor resources.
Reports
Reports are processed in separate queues, which can also be configured. The reports have three queues.
- Manual - in this queue, reports are processed, the generation of which users started manually (opened the interface and clicked the button or called the api). Processing such reports separately will allow the user to get fresh data in the report faster. And don’t wait while other reports are updated.
If report generation is started automatically on a schedule, then one of the following queues is used.
- If the report uses a small number of requests, then it is processed by the queue for quick reports.
This allows small reports to refresh faster and not wait for slow reports to be processed. - If a report is built on the basis of a large number of requests, then it enters the queue for slow reports. The generation time of which can take a long time.
The boundary for getting into the fast and slow queues is set by a separate parameter in the form of the number of tasks.
Changes in the number of threads are not instantaneous. It will change as soon as the thread pool has completed the current tasks (it may take a few minutes).


