Issue panel with reports (bottom)

Data Center This page documents Time in status, Timer, Stopwatch and Calendar fields for Jira Data Center and Server. On Jira Cloud? See Time in Status (Forge) for Jira Cloud.

You can configure who to show the panel to. According to what working calendar to count time in a specific project.
Here you can specify which reports to show in a particular project. {baseUrl}/secure/jibrokAllPanelConfigs!default.jspa
From admin search “Time in status” or “Bottom panel configs”
Here you can specify which reports to show in a particular project. You can also remove unnecessary statuses from the report. For example, the final status (Done, Close,…) in which the task spends all the time since closing.
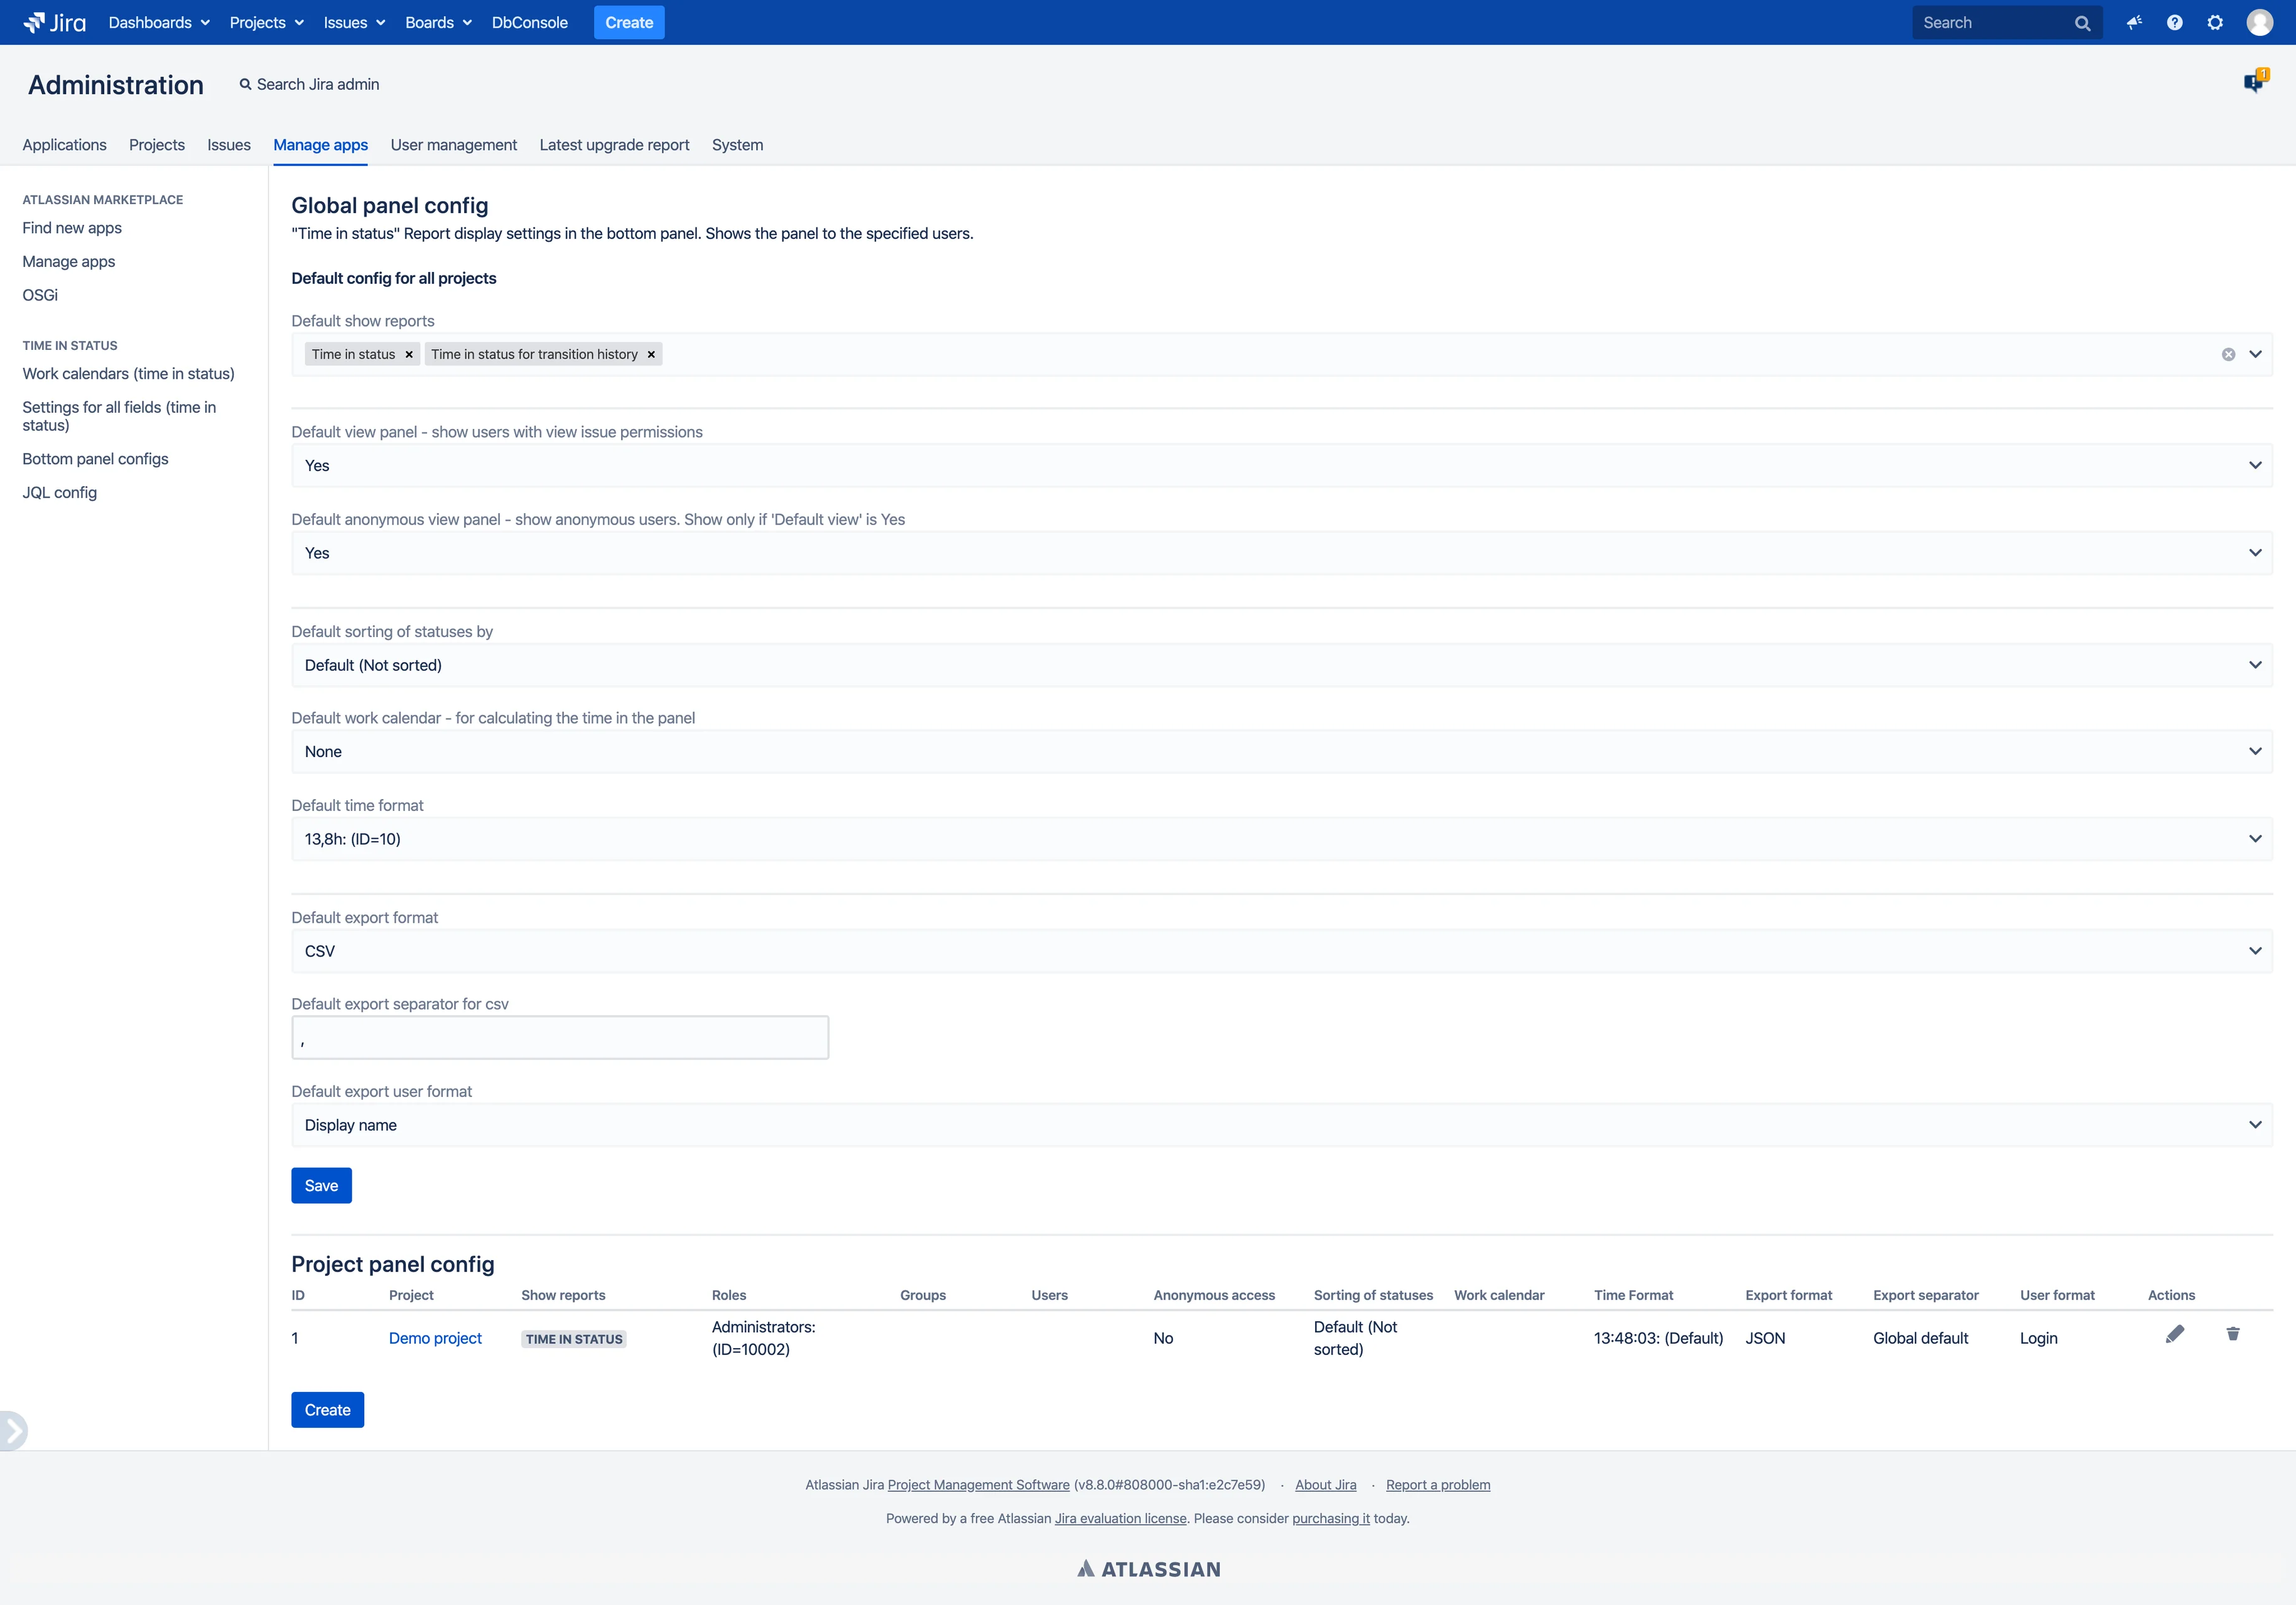
all-settings screenshot

Times in the panel are rendered in the panel's format and are truncated down to its smallest unit, so the assignee rows under a status total do not always add up to it. Hover over a time cell in any of the panel's report tabs to get a browser tooltip with the exact value down to the second - on both builds, Jira 10.x and Jira 11.3. See Truncation and totals.

Export

You can quickly export a report in one of the formats (JSON, CSV) from the issue view page. Default settings - sets the administrator globally or separately for the project.
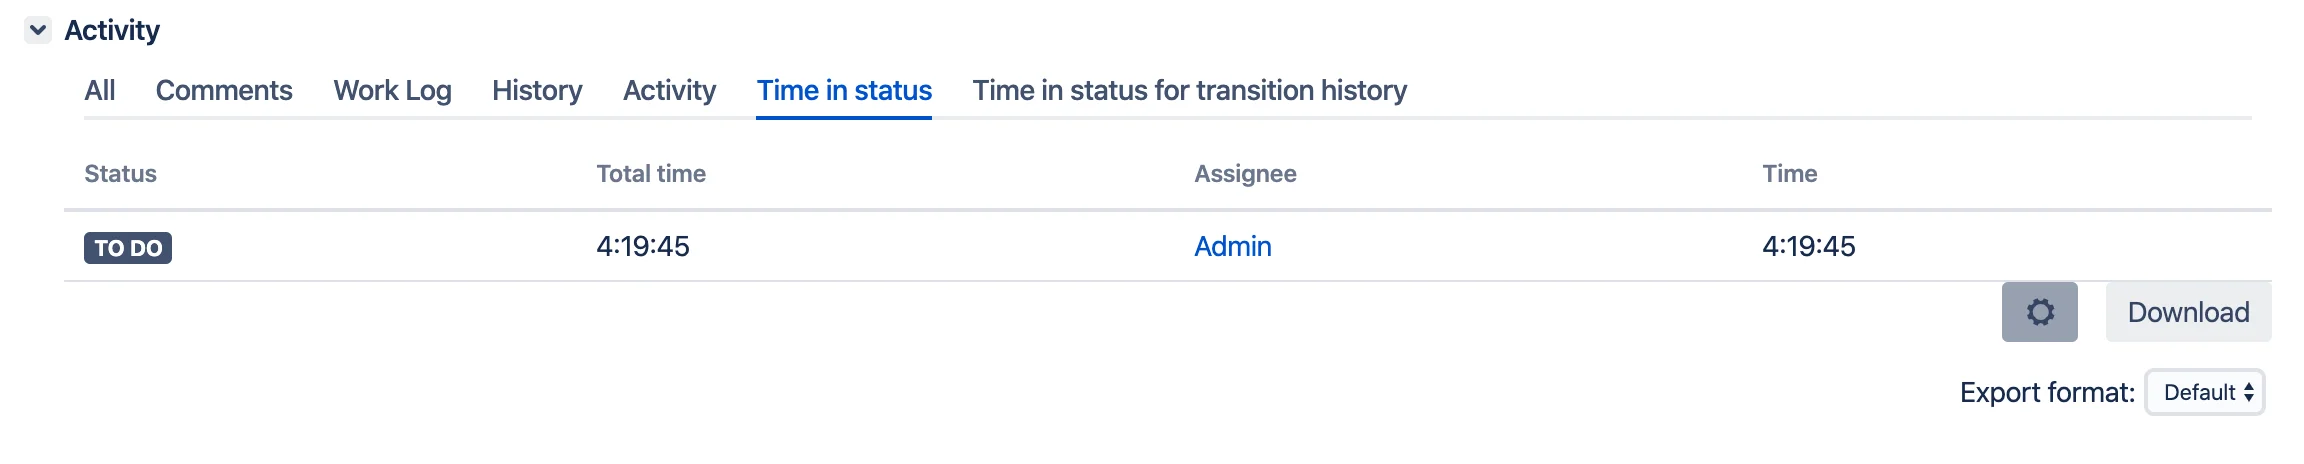
time-in-status-report screenshot

Each user can generate reports in the format he needs. The selection of settings is saved for each user.
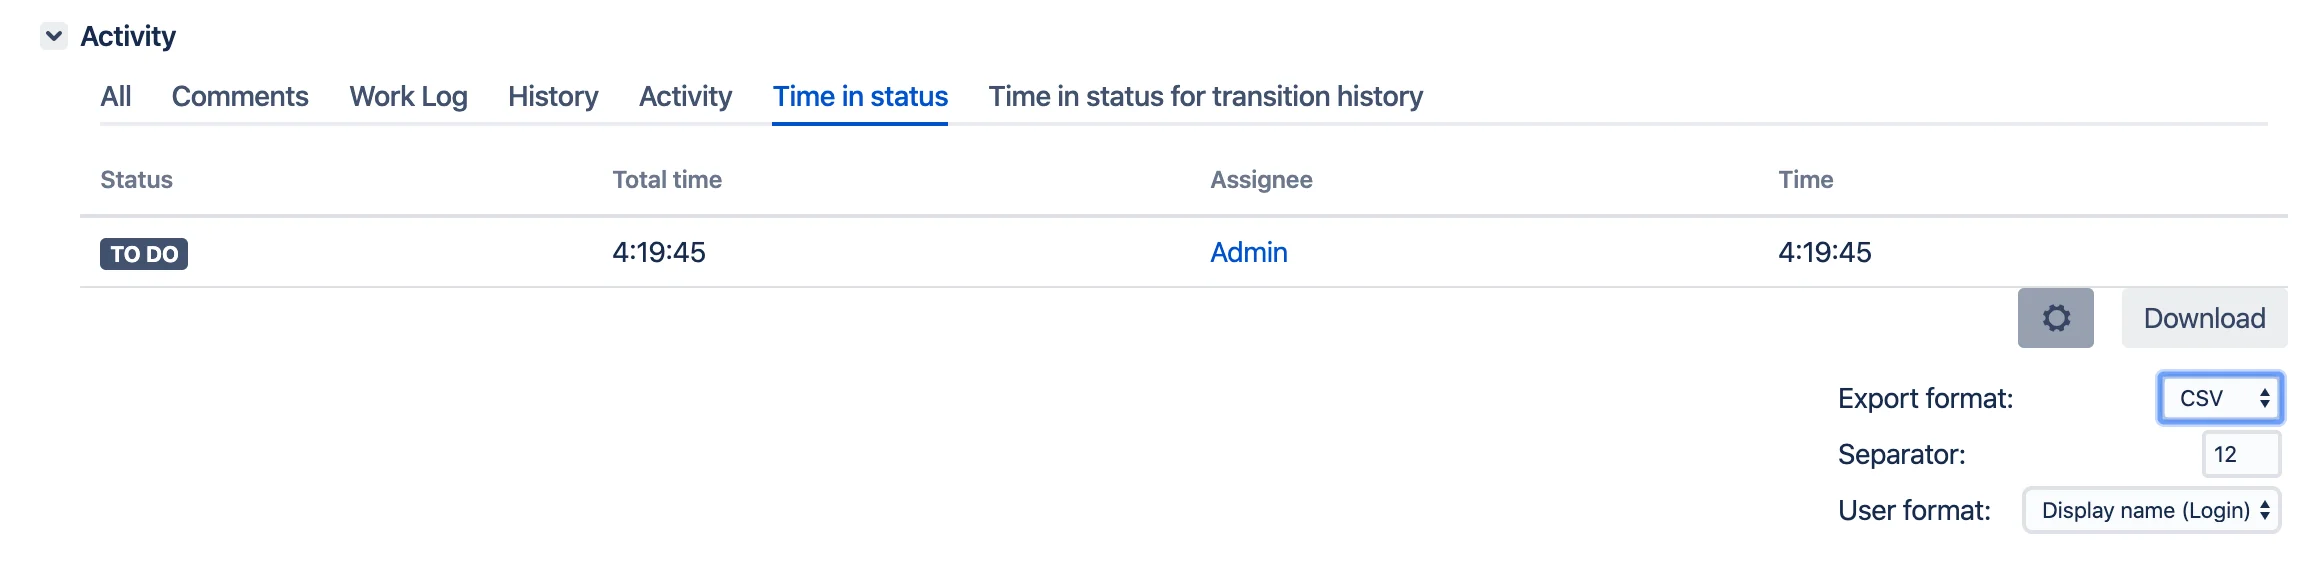
time-in-status-report-export screenshot


JiBrok time in status Time in status | SLA | Timer | Stopwatch
Migration
Release notes
Tutorials
Settings
Troubleshooting
Work calendars
Time in status
Timers and Stopwatches
Stopwatch
Timer
Additional functions
Issue panels
Reports
Field Helpers
Other fields
API
Reference information