Detail history for timer and stopwatch

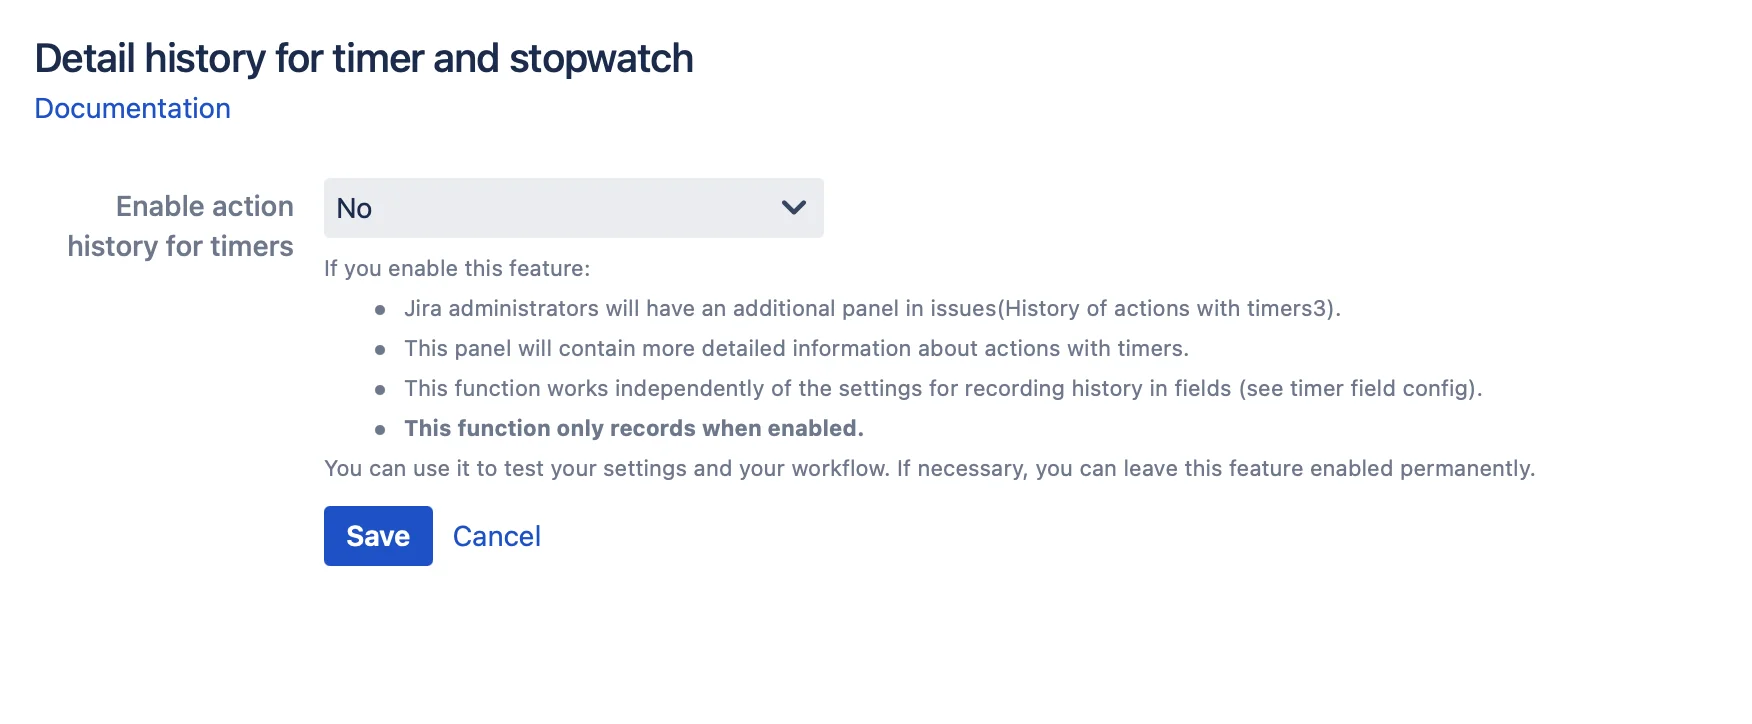
In complex systems with a lot of integrations, plugins, scripts and other things, it is sometimes very difficult to understand what went wrong. To simplify the testing procedure and debug settings, an additional detailed history has been made for timers and stopwatches. It records the source that caused the trigger to which the counter and the change that occurred to the data were registered.

The default setting is disabled and enabled at the discretion of the administrator. It can also be enabled on an ongoing basis.

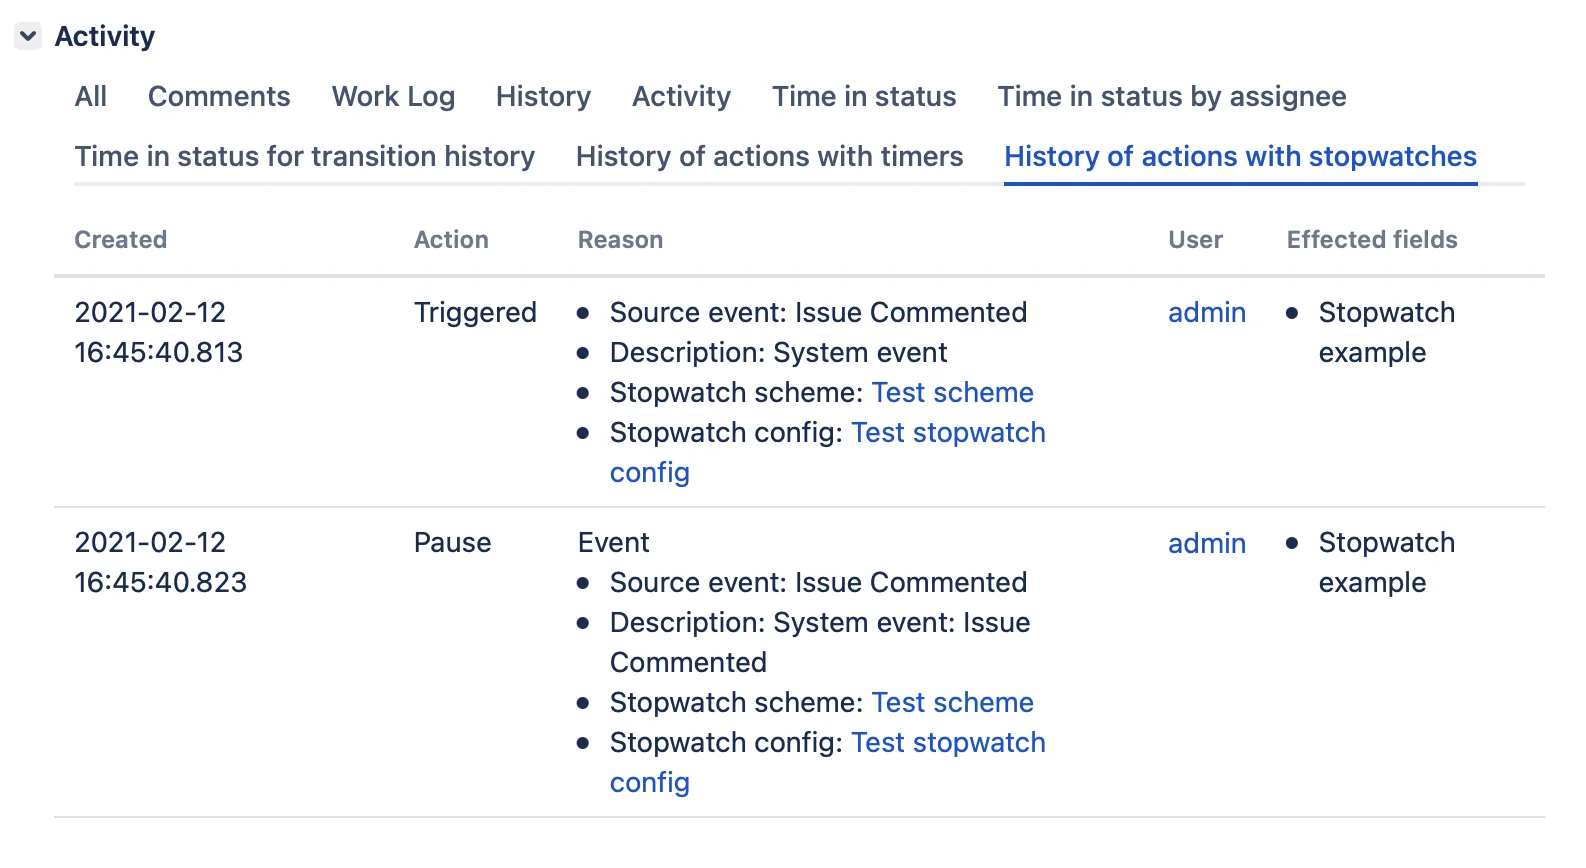
When this option is enabled, two additional panels with detailed logs appear in the task. These panels are available only to administrators.


Autotrack settings
Manual control for Timers and Stopwatches
JiBrok message field Message field
JiBrok time in status Time in status | SLA | Timer | Stopwatch
Tutorials
Settings
Work calendars
Time in status
Timers and Stopwatches
Stopwatch
Timer
Additional functions
Issue panels
Reports
Field Helpers
Other fields
API
Reference information
JiBrok Switch to User + Delegating SU (Jira) Switch to User + Delegating SU (Jira)
JiBrok time in status Time in status for Jira Cloud
Work calendars
Time in status fields
Issue panels
Reports
Service tools
Reference information
JiBrok Calculated fields Calculated fields (JBCF)
JiBrok Calculated fields Calculated fields (JBCF) for Jira Cloud
JBCF fields
Service tools
JiBrok Timer Timer field | SLA for Jira Cloud
Work calendars
Timer fields
Issue panels
Service tools
JiBrok Stopwatch Stopwatch for Jira Cloud
Work calendars
Stopwatch fields
Issue panels
Service tools
JiBrok Time between dates Time between dates for Jira Cloud
Time between dates fields
JiBrok Fields panel for Jira Service Management (JSM) Fields panel for Jira Service Management (JSM)
JiBrok Display Linked Issues Display Linked Issues
User helper for JiBrok cloud apps User helper for JiBrok cloud apps