 Message field
The Statistics page provides comprehensive insights into your Message Field usage across your Jira instance. This powerful analytics tool helps administrators monitor, optimize, and troubleshoot their Message Field configurations.
Accessing Statistics
To access the Statistics page:
- Navigate to Jira Administration > Manage apps
- Find Message Field in the installed apps list
- Click Statistics in the Message Field section
⚠️ Note: Statistics page requires Jira System Administrator or Jira Administrator permissions and a valid Message Field license.
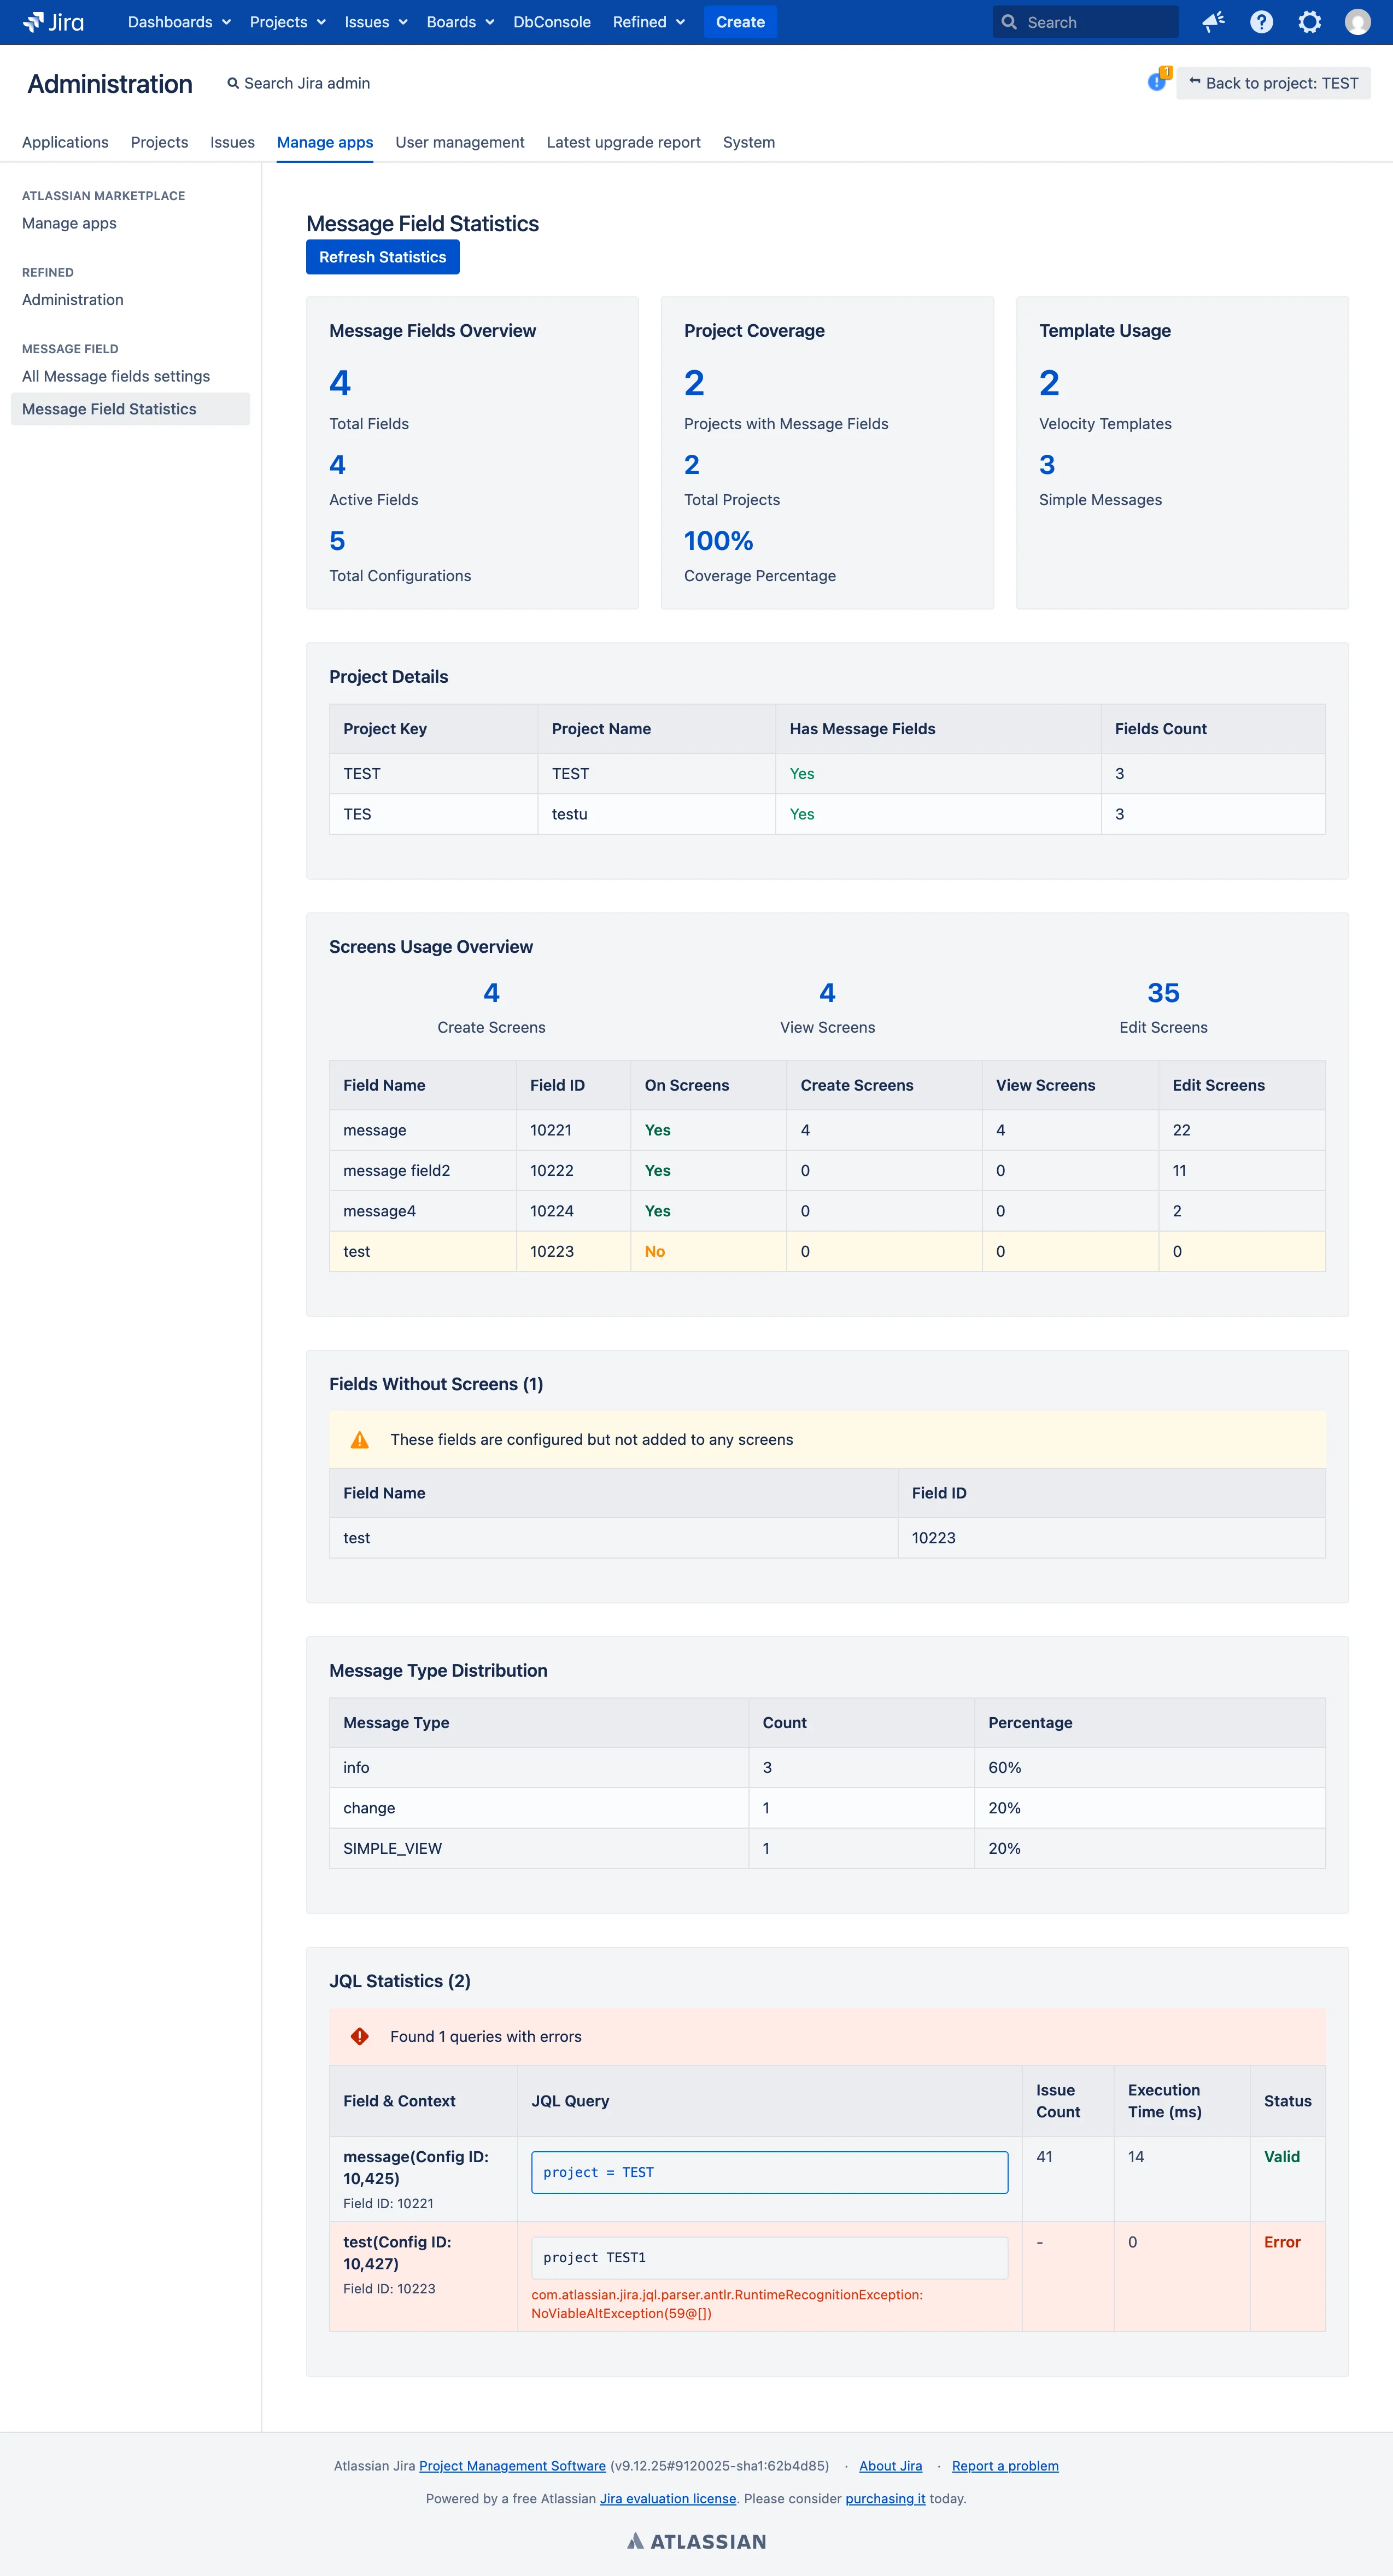
Overview Statistics
Message Fields Summary
- Total Fields: Total number of Message Field custom fields created
- Active Fields: Number of fields with at least one configuration
- Total Configurations: Total number of field configurations across all contexts
Project Coverage
- Projects with Message Fields: Number of projects using Message Fields
- Total Projects: Total number of projects in your Jira instance
- Coverage Percentage: Percentage of projects utilizing Message Fields
Template Usage
- Velocity Templates: Number of configurations using dynamic Velocity templates
- Simple Messages: Number of configurations using static messages
Detailed Analytics
Project Details
View a comprehensive table showing:
- Project key and name
- Whether each project has Message Fields configured
- Number of Message Fields per project
This helps identify projects that could benefit from Message Field implementation.
Screen Usage Overview
Monitor how Message Fields are distributed across different screen types:
- Create Screens: Fields available during issue creation
- View Screens: Fields visible when viewing issues
- Edit Screens: Fields available during issue editing
Fields Analysis
The statistics page tracks each Message Field’s screen presence:
- Field name and ID
- Whether the field is added to any screens
- Count of create, view, and edit screens containing the field
⚠️ Warning: Fields highlighted in yellow are configured but not added to any screens, making them invisible to users.
Message Type Distribution
View the breakdown of different message types being used:
- Distribution percentages for each message type
- Count of configurations per type
- Most popular message type configurations
JQL Performance Analytics
JQL Query Monitoring
The statistics page analyzes all JQL conditions used in Message Field configurations:
- Query Validation: Checks if JQL syntax is correct
- Performance Metrics: Execution time for each query
- Issue Count: Number of issues returned by each query
- Error Detection: Identifies problematic queries
Performance Indicators
- 🟢 Fast Queries: Execute in under 250ms
- 🟡 Slow Queries: Take longer than 250ms (performance warning)
- 🔴 Error Queries: Invalid syntax or execution errors
- ⏱️ Timeout Queries: Queries that exceed 5-second limit
Query Details
For each JQL condition, view:
- Field & Context: Which Message Field uses the query
- JQL Query: The actual JQL condition (clickable link for valid queries)
- Issue Count: Number of matching issues (red highlighting for >10,000 results)
- Execution Time: Query performance in milliseconds
- Status: Valid, Error, or Timeout indication
- Warnings: Any JQL warnings from Jira
Using Statistics for Optimization
Performance Optimization
- Identify Slow Queries: Look for JQL queries with high execution times
- Optimize Heavy Queries: Refactor queries returning more than 10,000 issues
- Fix Error Queries: Address invalid JQL syntax
- Monitor Timeouts: Investigate queries that consistently time out
Configuration Cleanup
- Remove Unused Fields: Identify fields not on any screens
- Project Coverage: Expand Message Field usage to uncovered projects
- Screen Optimization: Ensure fields are on appropriate screen types
Technical Details
Data Refresh
- Statistics are calculated in real-time when accessed
- Click Refresh Statistics to update data
- Large instances may take longer to process all data
Security
- Only Jira Administrators can access statistics
- All JQL queries are executed with admin permissions for validation
- No sensitive data is exposed in the statistics view
Performance Considerations
- JQL queries have a 5-second timeout limit
- Statistics gathering is optimized for large Jira instances
- Heavy usage instances may see longer load times
Troubleshooting
Common Issues
- Slow Loading: Large number of projects or configurations may increase load time
- JQL Timeouts: Complex queries may exceed timeout limits
- Permission Errors: Ensure proper admin permissions are assigned
Tips
- Run statistics during off-peak hours for better performance
- Consider simplifying complex JQL conditions that consistently time out
- Use project-specific contexts to reduce query complexity
The Statistics page is an essential tool for maintaining healthy Message Field configurations and ensuring optimal performance across your Jira instance.


