In the new version, we have added a number of functions for calculating various statistics.
General information
- Functional for working with statistics is able to count average values, highs, lows and percentiles.
- You can display the calculation of statistics in fields, web panels or dashboards.
- You can use JQL search to work with statistical data.
More details
Fields
- In the field settings, you can configure how the statistical functions are counted. Tasks are configured (how much and for what period to take) that will be used to calculate statistics.
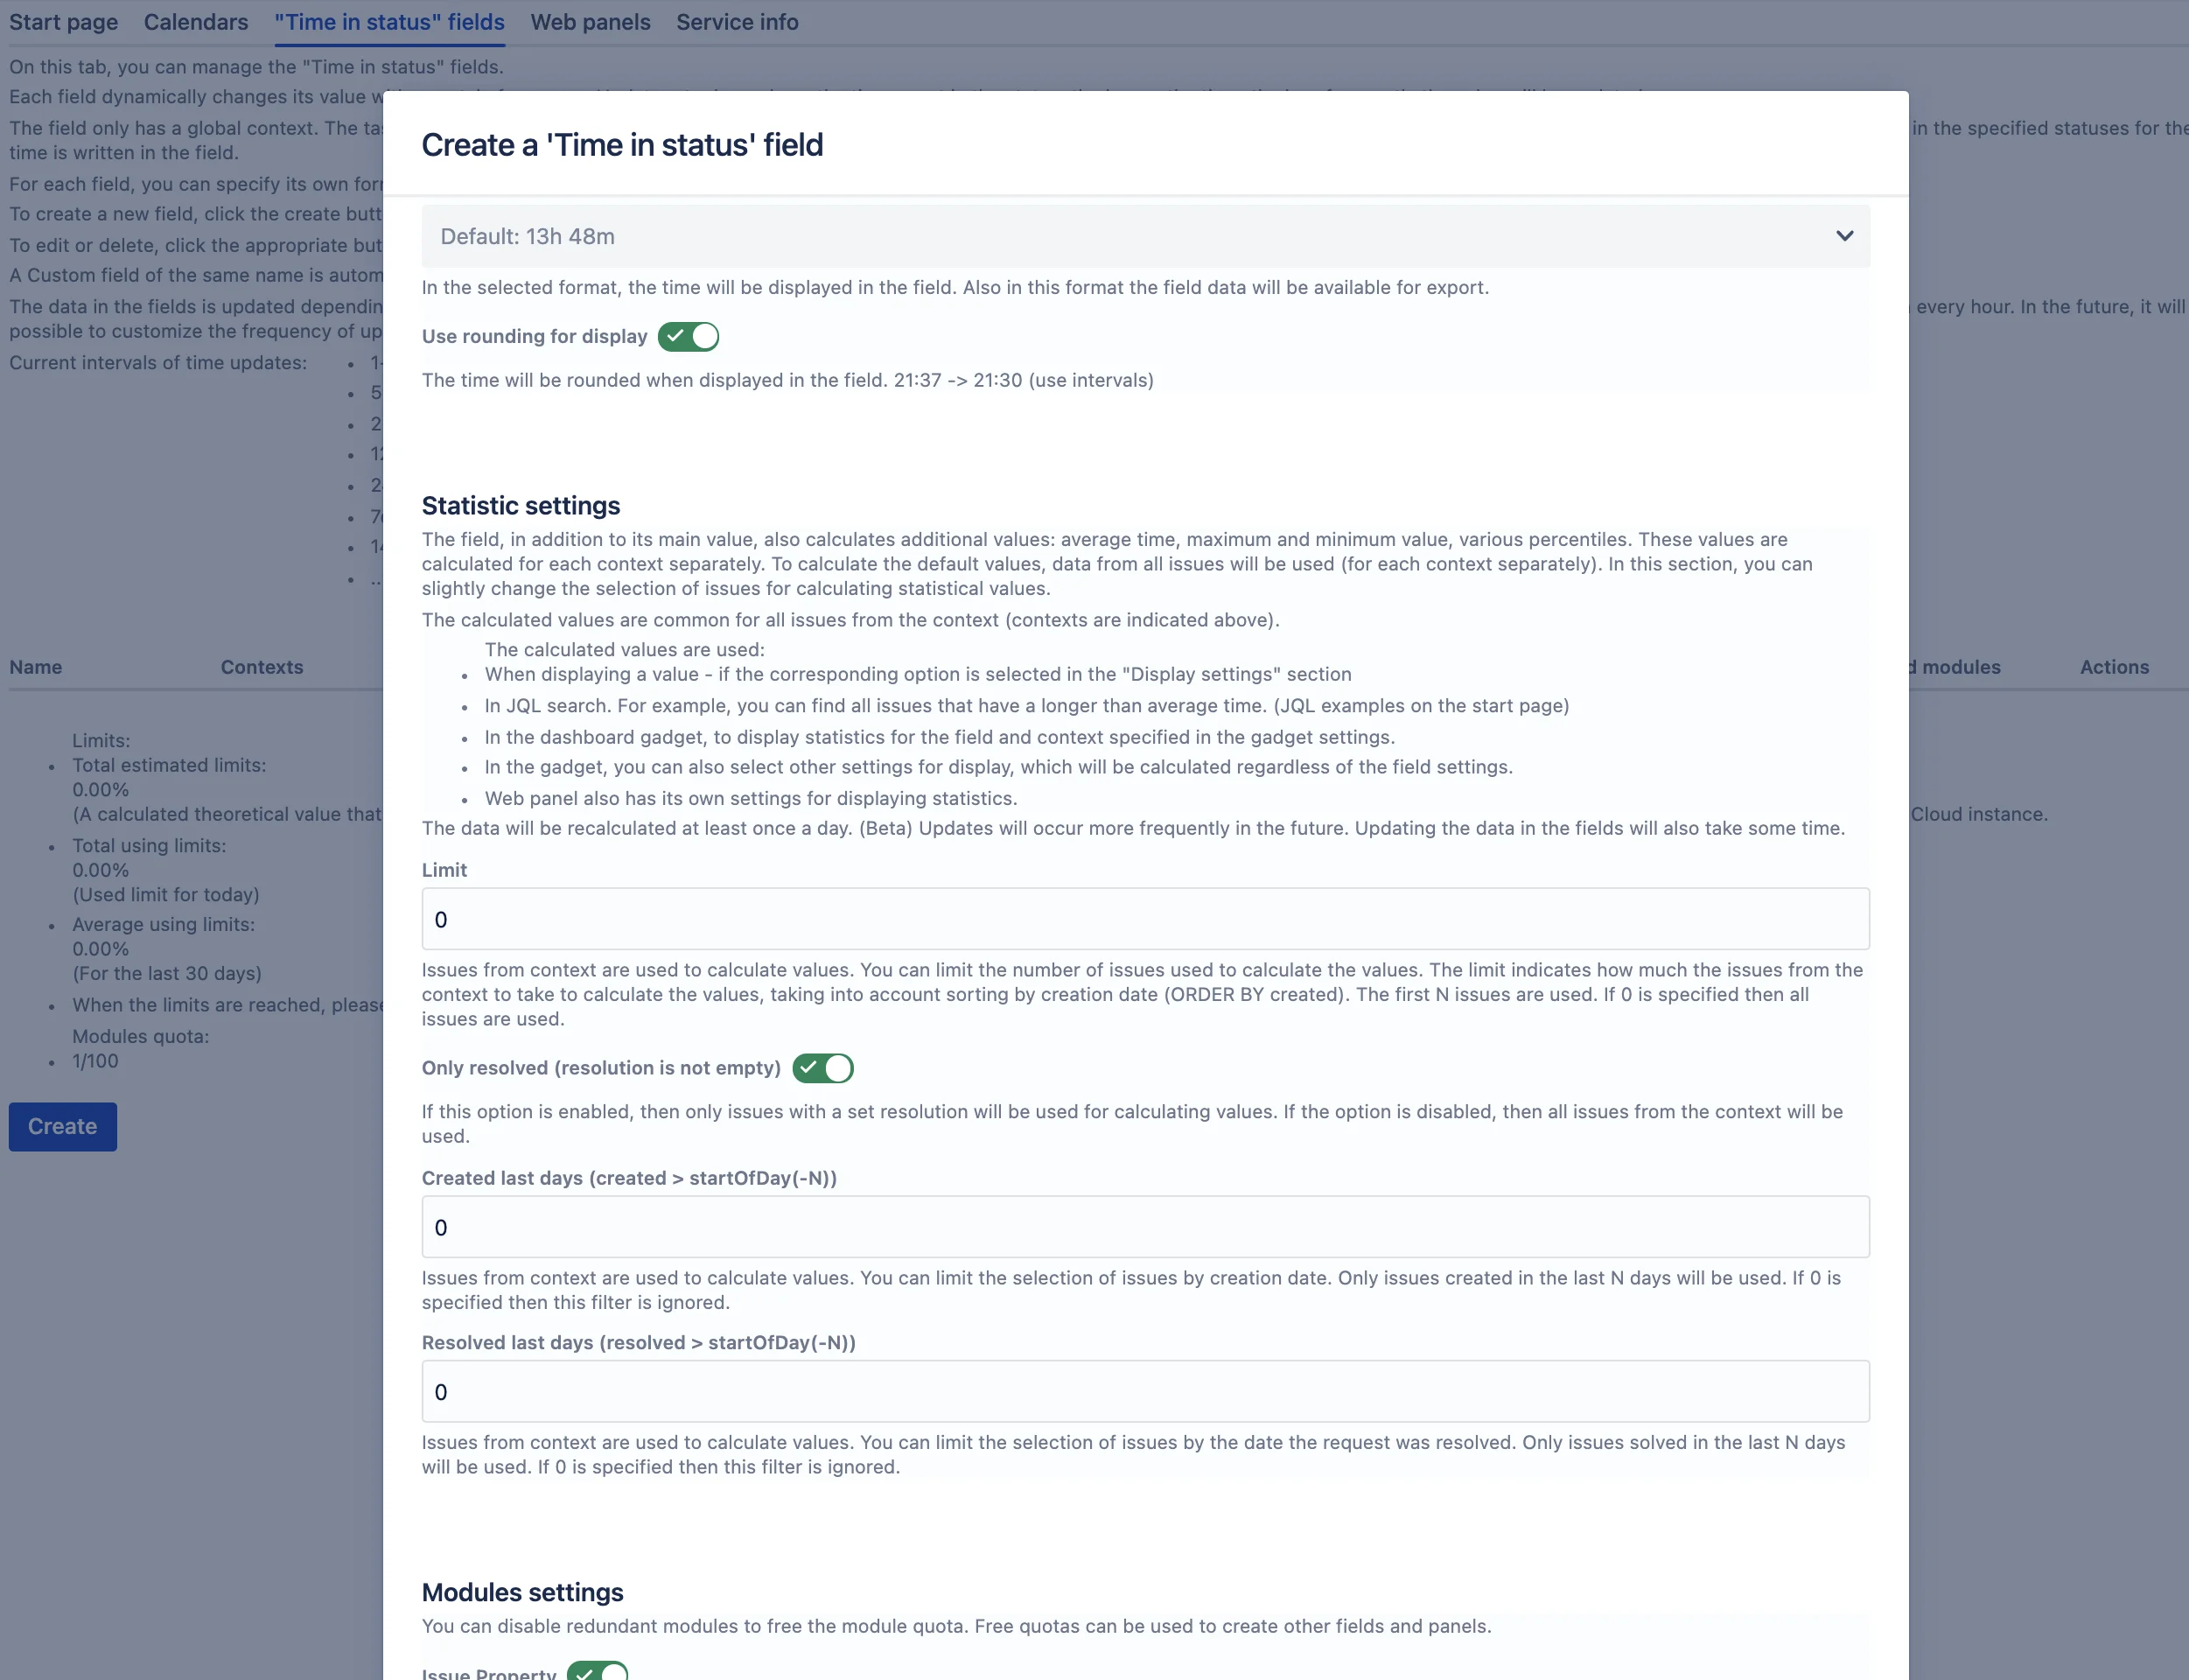
- Field statistics are calculated for each context separately.
- Functions will always be calculated and will be available to work in JQL(The data is updated at least once a day.).
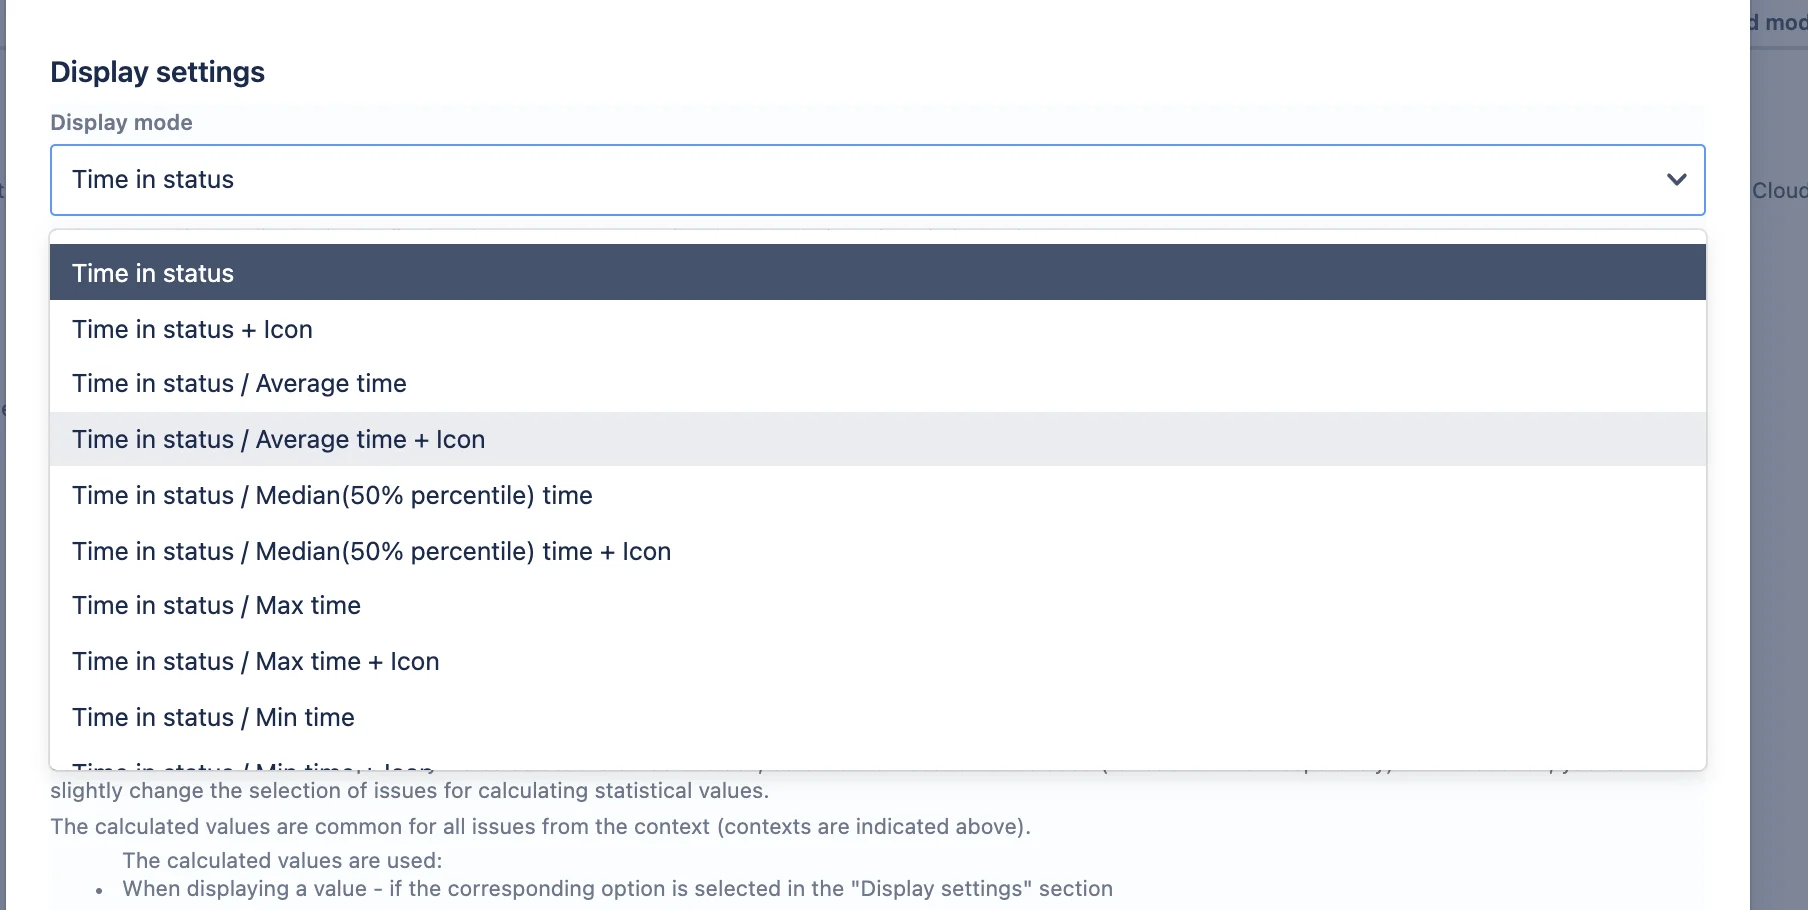
- You can also add a single function display to a field.

- Statistics are calculated separately from the base value. Therefore, changing field settings will not immediately reflect updated statistics.
JQL
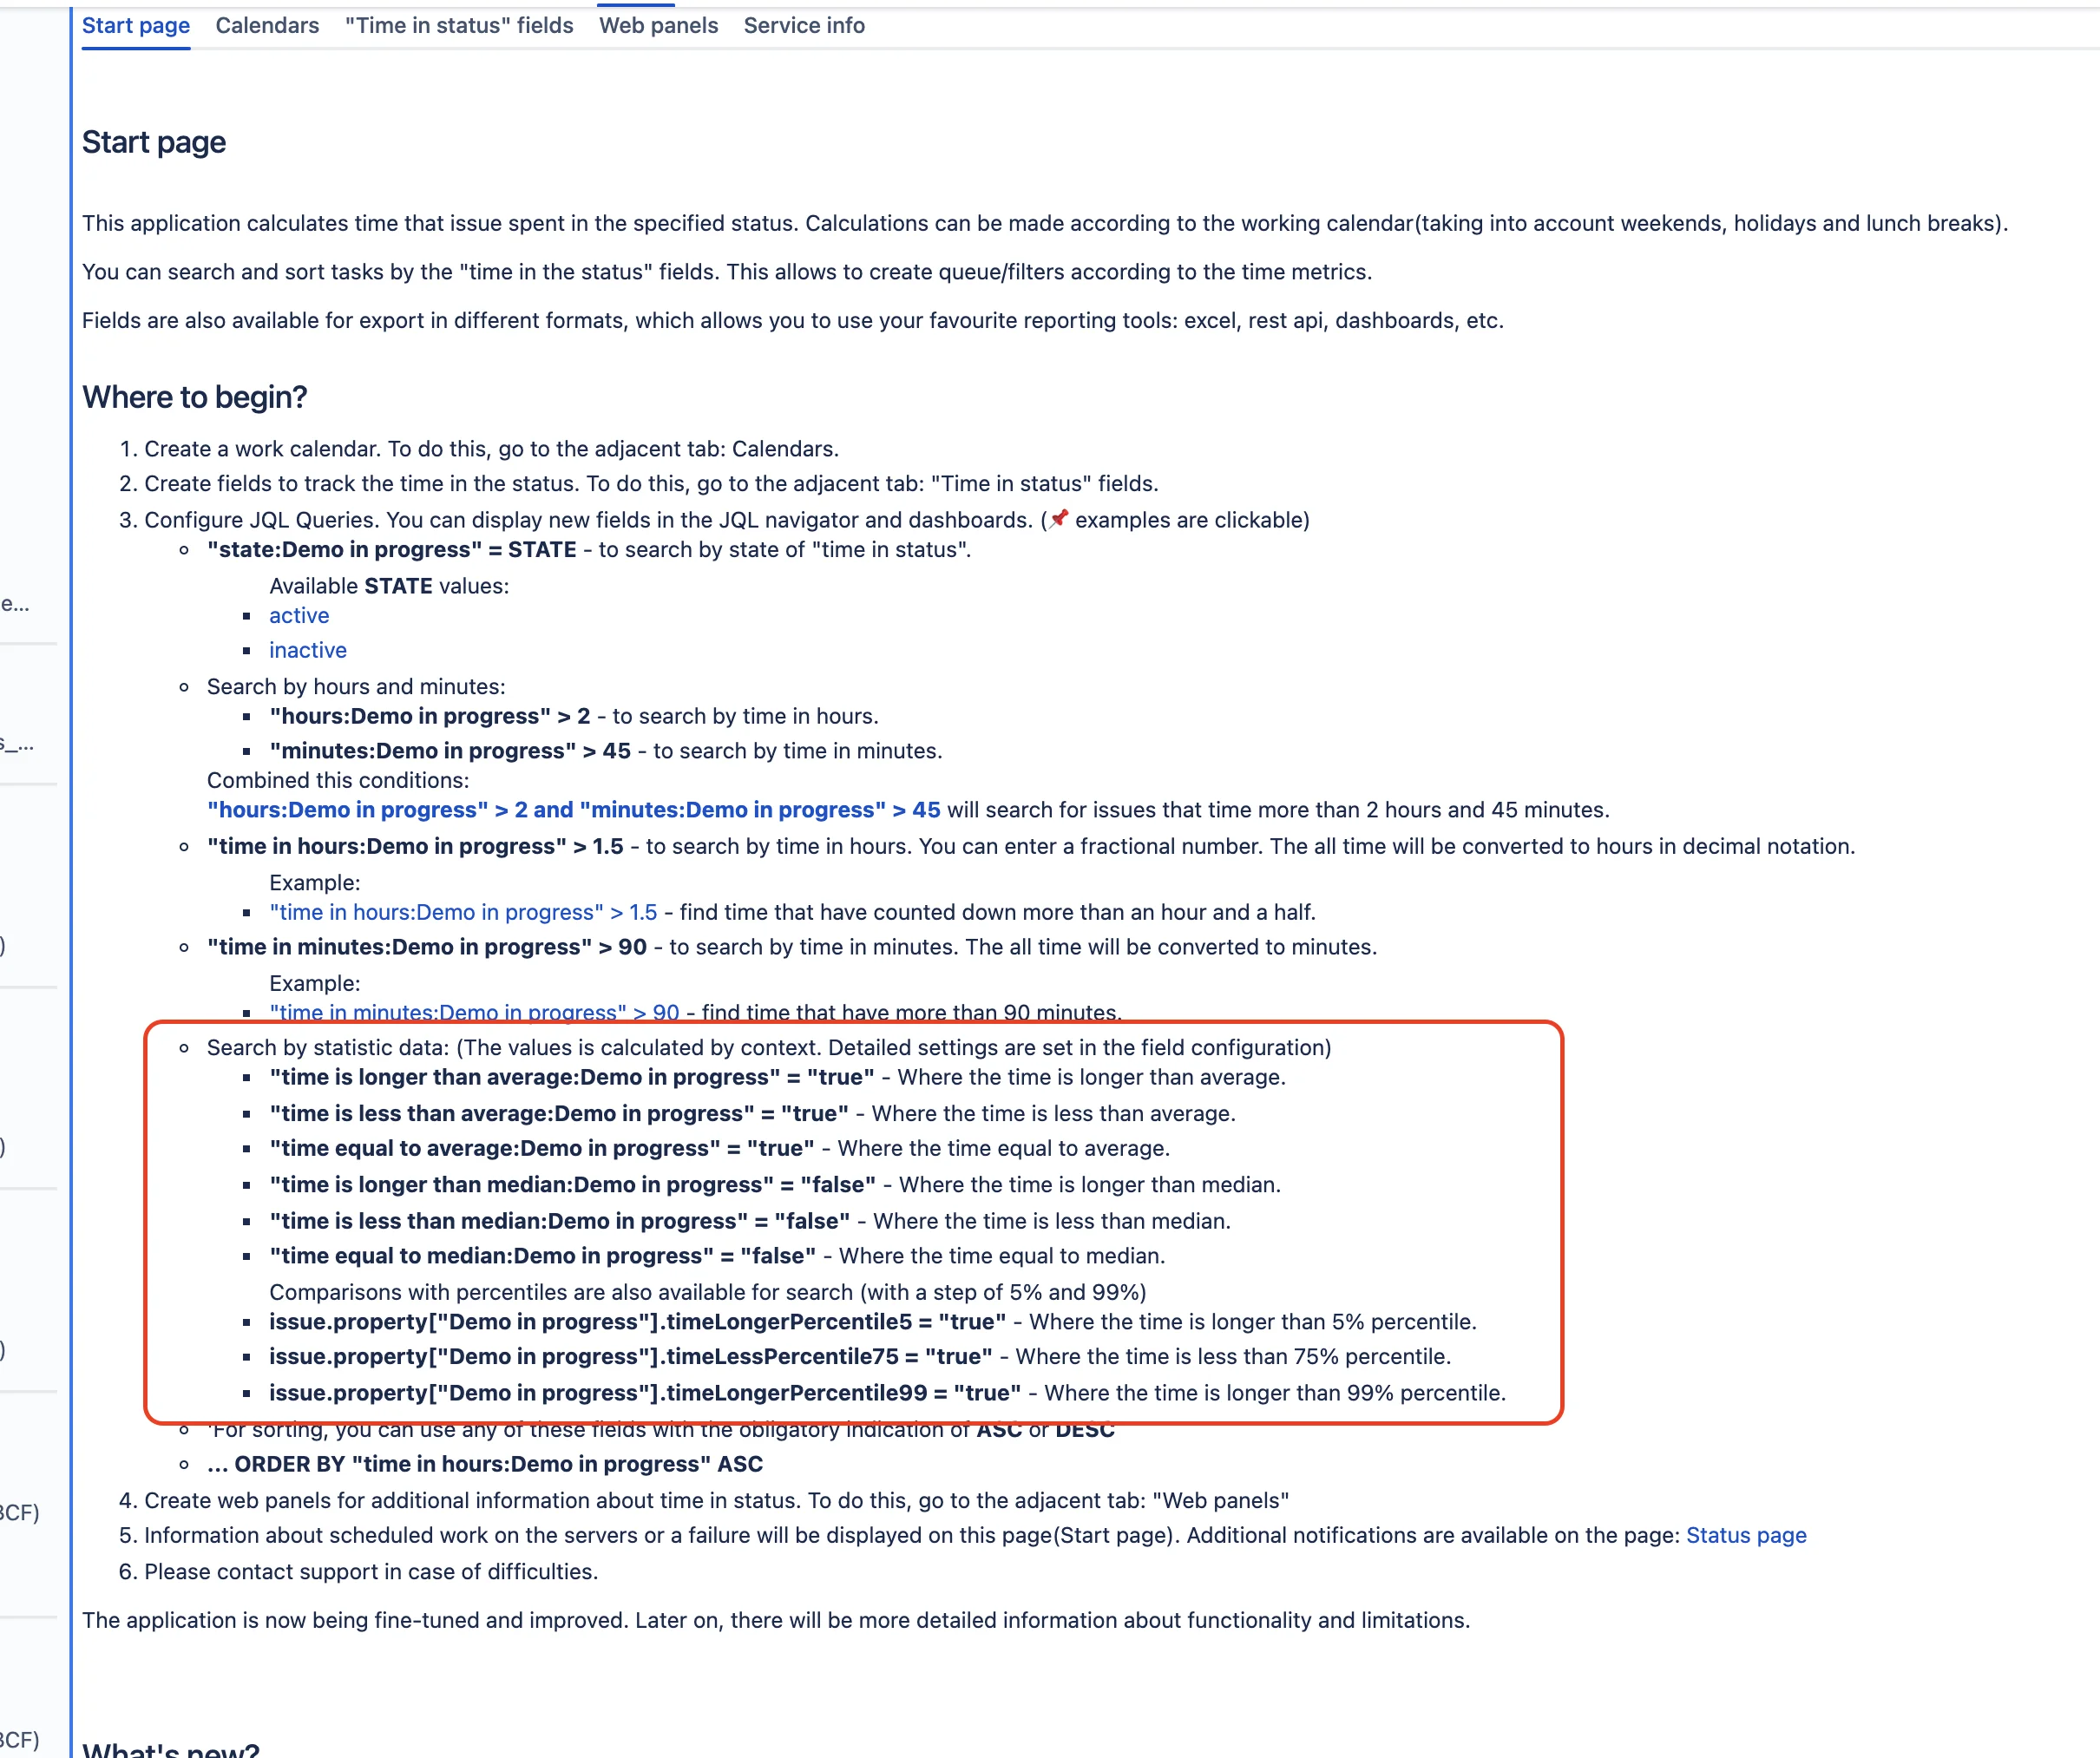
- On the start page, we have added examples of JQL queries for working with statistics. Functions work according to the logic of comparing the time value in the task with the value of the specified function. (Each function value is calculated for each context separately)
Web Panels
- For panels, issues for calculating statistics are set up according to a similar scheme (as for fields).
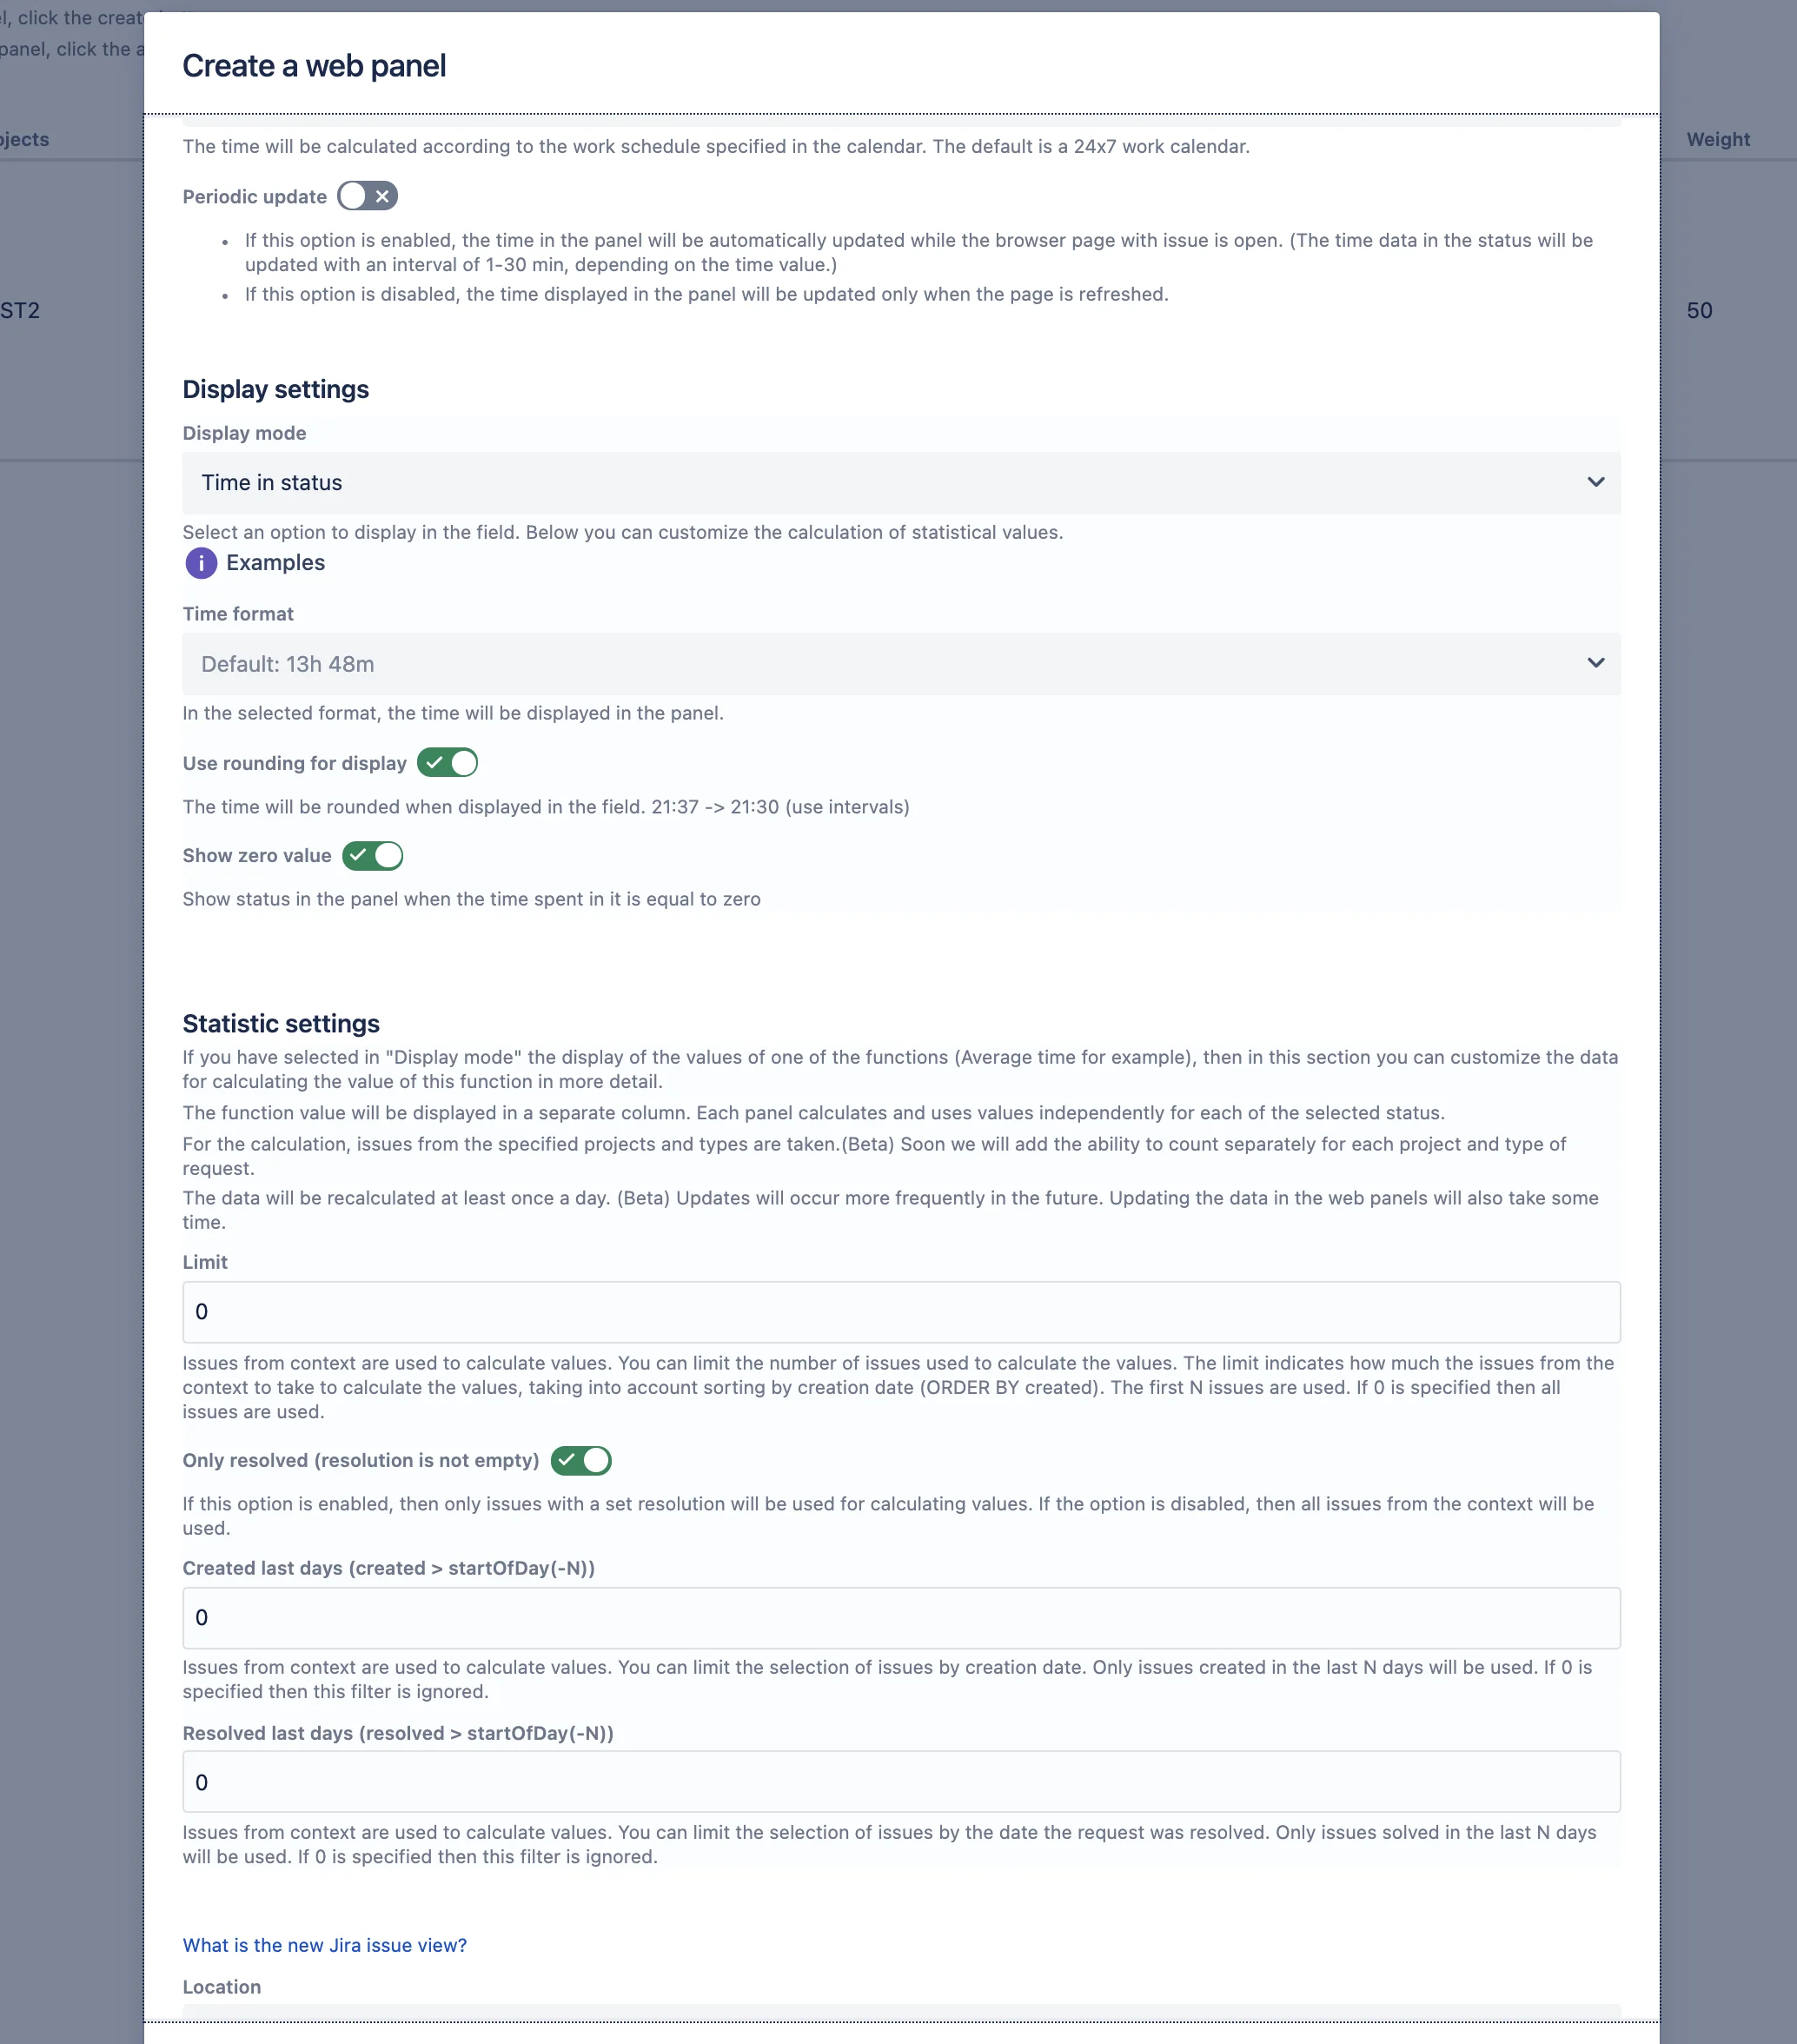
View example:
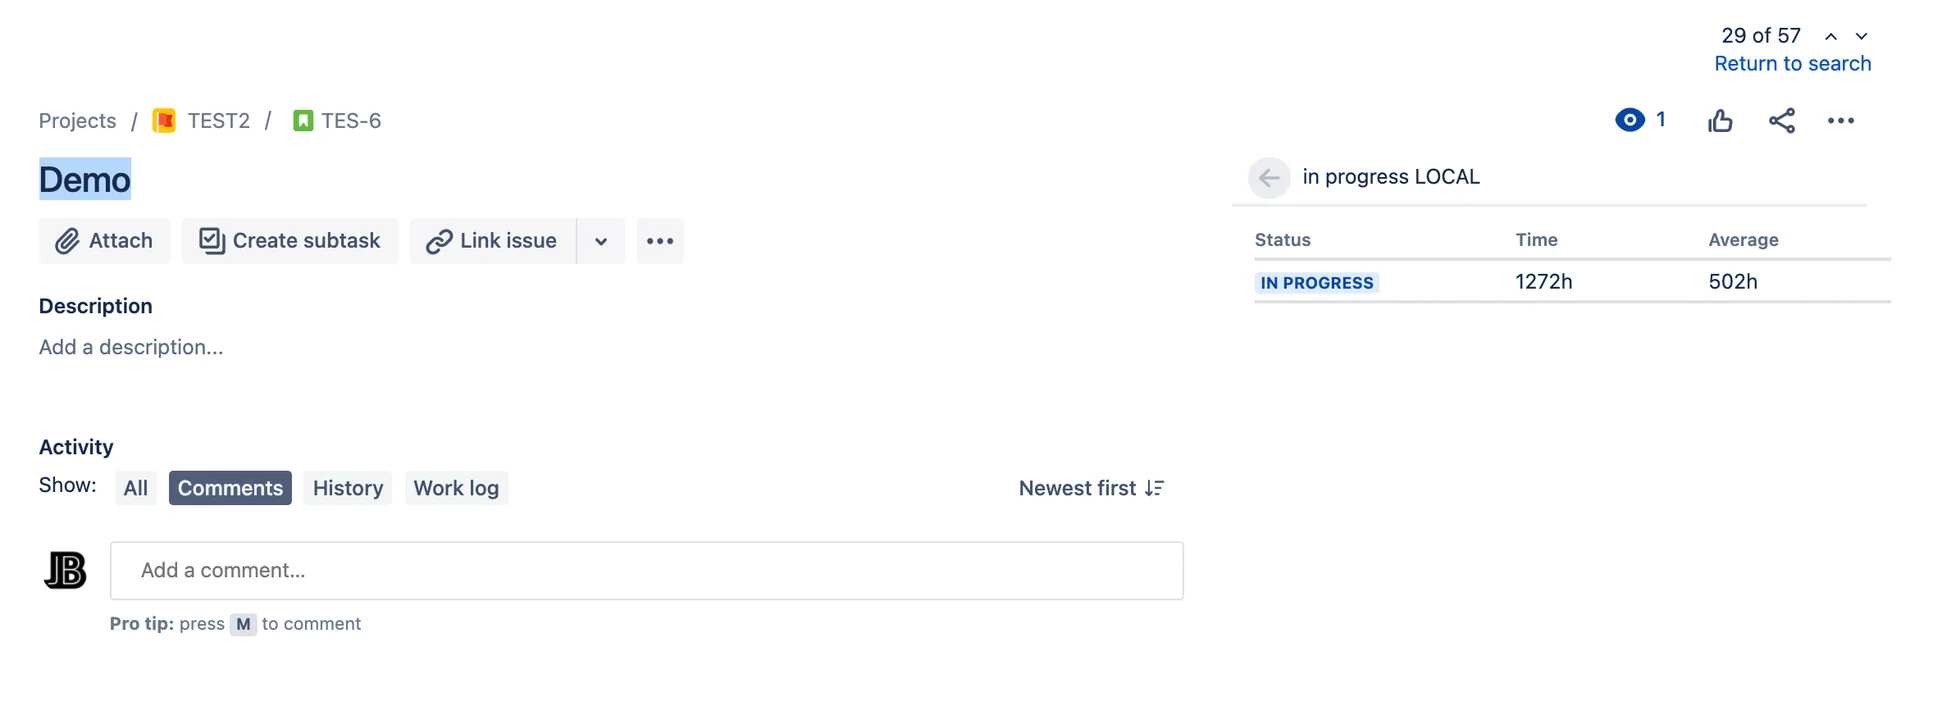
- Statistics are calculated as a whole for each panel separately (for all specified projects and request types together). We will do the division in the near future so that the data in the panel can be calculated separately for each project/issue type.
Dashboard gadget
- We have also prepared a gadget for the desktop. It allows you to calculate any statistics for any request. He is as flexible as possible.
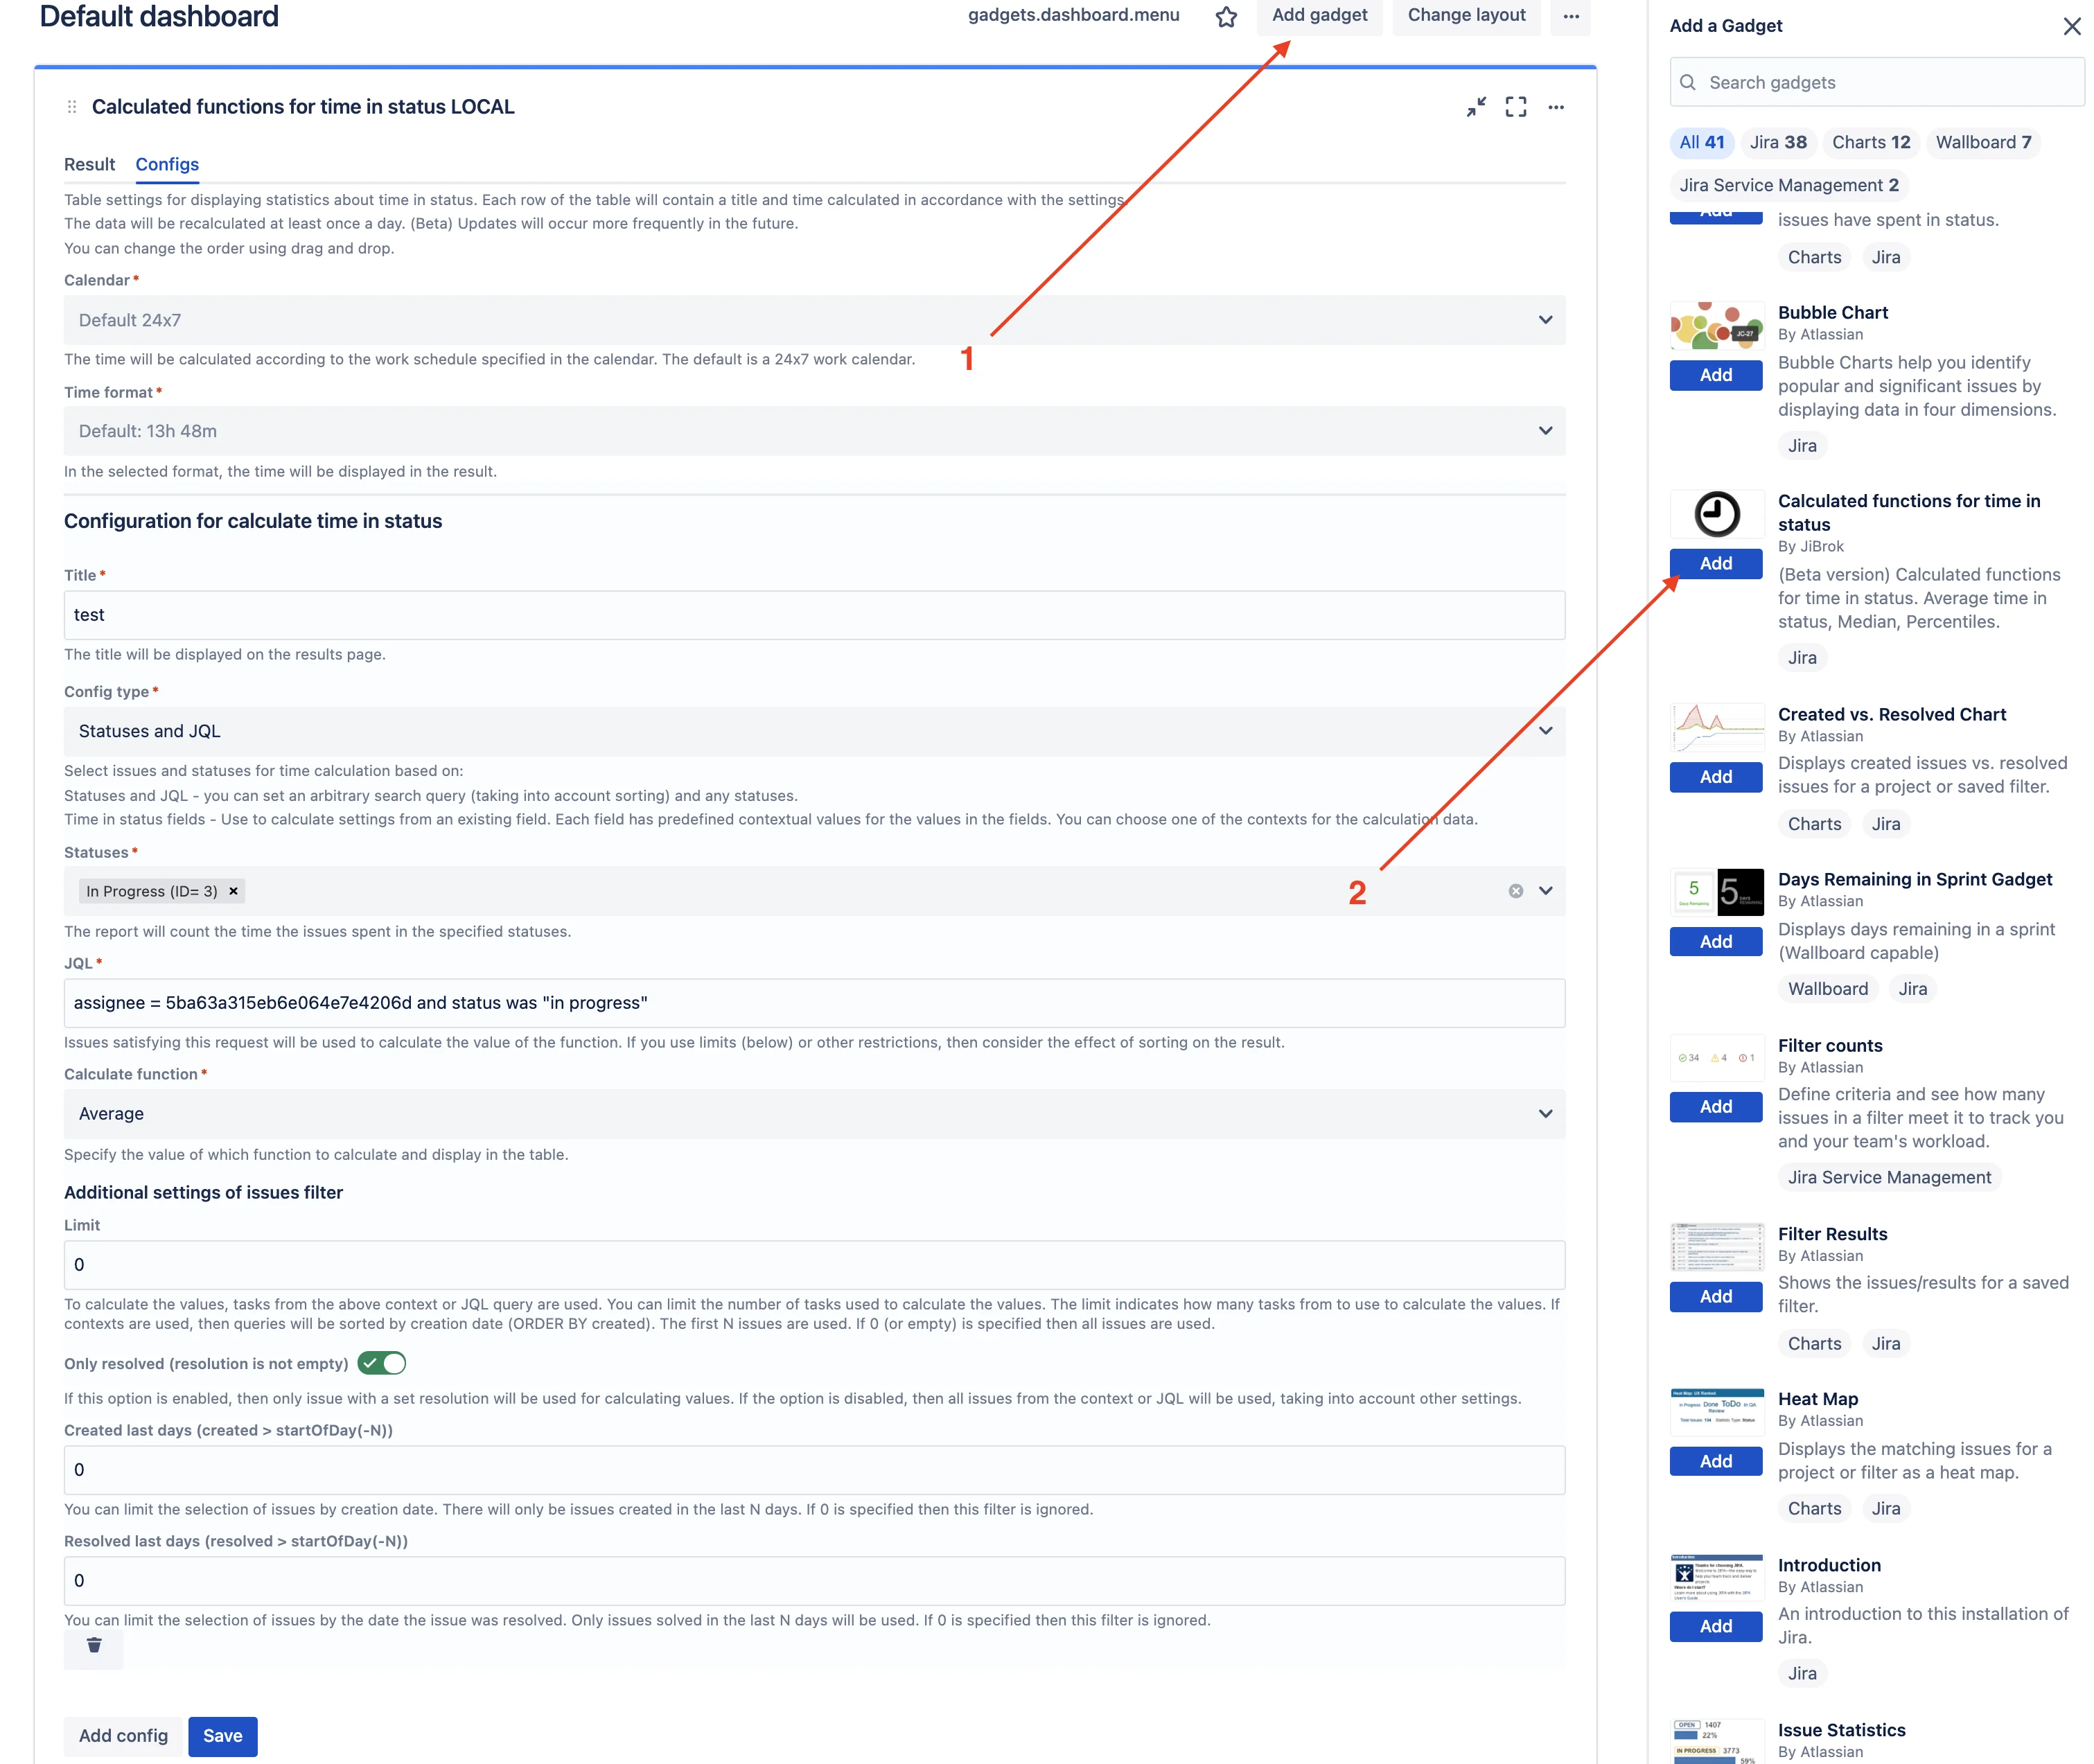
View Example:
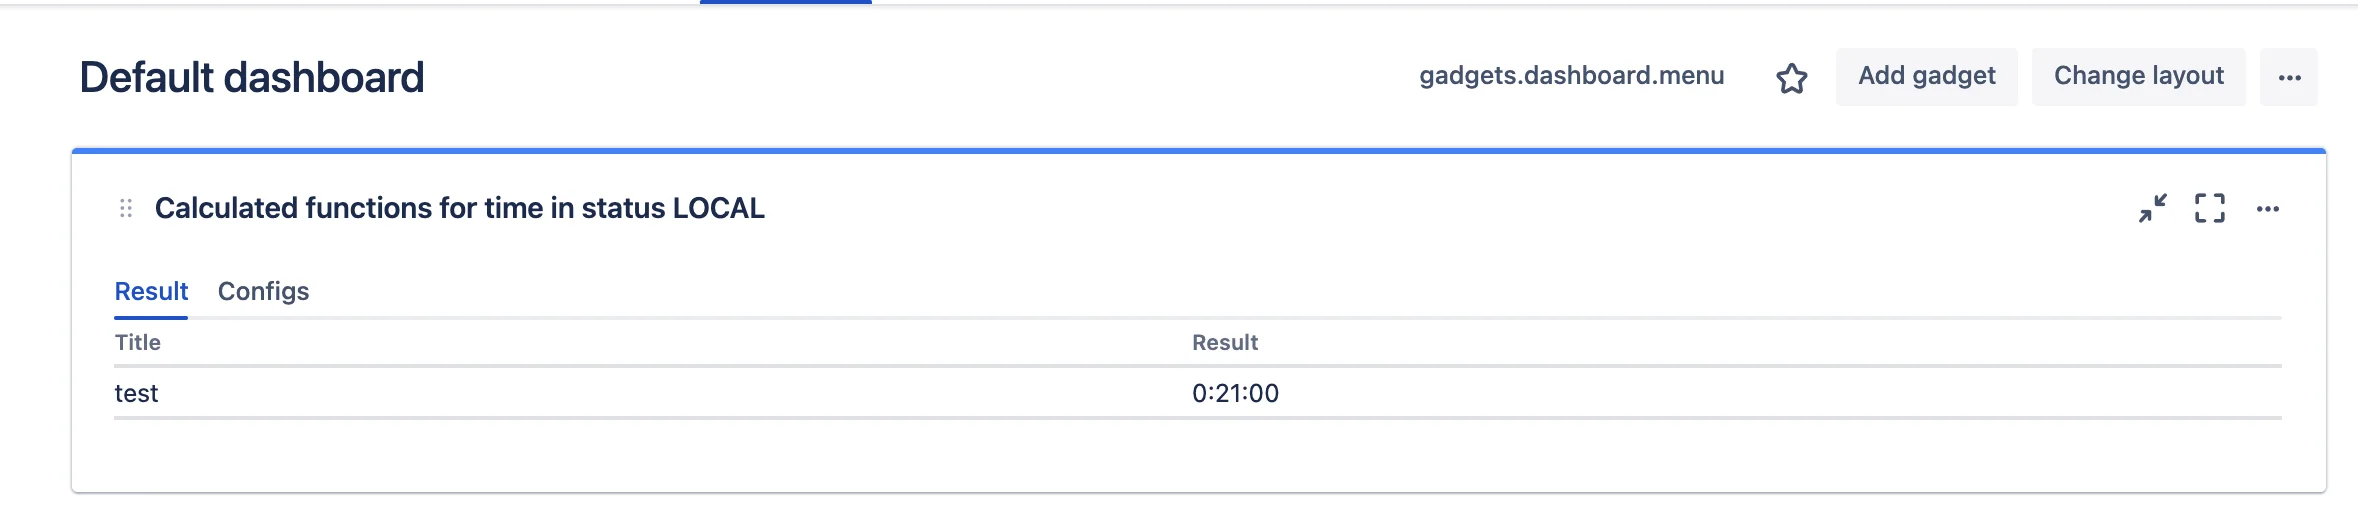
- This is a small report in which two columns are configured. The first is the heading, the second is the value calculated in accordance with the settings.
- You can add an unlimited number of lines.
- For each line, queries are indicated on the basis of which it is necessary to calculate the value of the function and the function itself. You can specify arbitrary statuses and Jql query, or select one of the contexts of existing fields.
- The gadget is still in Beta version and does not support “personal appeal” - requests like assignee = currentUser () do not work, but you can specify a specific user.
 Message field
 Time in status | SLA | Timer | Stopwatch
 Switch to User + Delegating SU (Jira)
 Calculated fields (JBCF)
 Timer field | SLA for Jira Cloud
 Stopwatch for Jira Cloud
 Time between dates for Jira Cloud
 Fields panel for Jira Service Management (JSM)
 Display Linked Issues
 User helper for JiBrok cloud apps
 JiBrok Studio for Jira Cloud

